Kepler Retail Radar
The Kepler Retail Radar is a monthly publication providing information, analysis and commentary on retail trends and consumer behavior using aggregated Kepler Measures as the basis. Kepler Measures include passers-by (outside) foot traffic, customer counts, shopfront and sales conversion rates and sales from retail stores in more than 350 shopping precincts across in Australia and New Zealand.
In our previous Retail Radar (edition April 2017), we made a twofold Mother’s Day 2017 prediction for specialty retail stores that:
-
(Obvious) Sales conversion will surge on the Saturday before Mother’s Day Sunday.
-
(Not obvious) Customers began browsing – not buying yet! – en mass for Mother’s Day gifts on the Thursday and Friday before Mother’s Day (Sunday).
Mother’s Day 2017 occurred on Sunday 14 May 2017 and, after reviewing the data, we are pleased to announce that our predictions were accurate.
These together will other analyses are presented in this Kepler Retail Radar. We hope that our findings can assist with your retail planning for Mother’s Day 2018.
As Kepler monitors both outside store and inside store traffic and the associated conversion rates (POS data used), we are one of the few sources for such a comprehensive analysis.
Figure 1.1a is 2017 data and Figure 1.1b is data from 2016 for your reference:
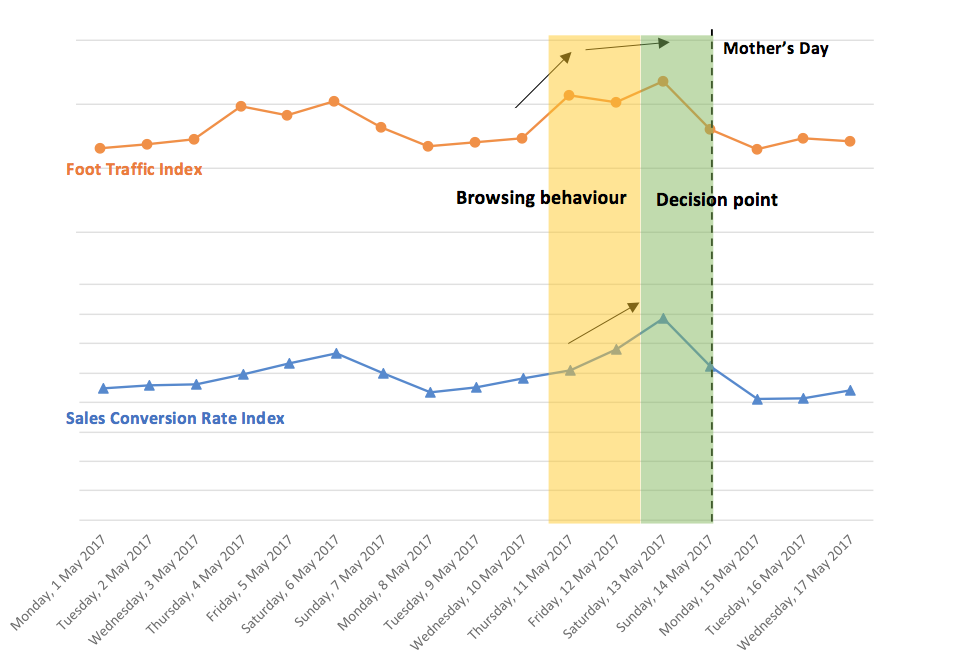 Figure 1.1a Sales Conversion Rate and Foot traffic Index before and after mother’s day 2017.
 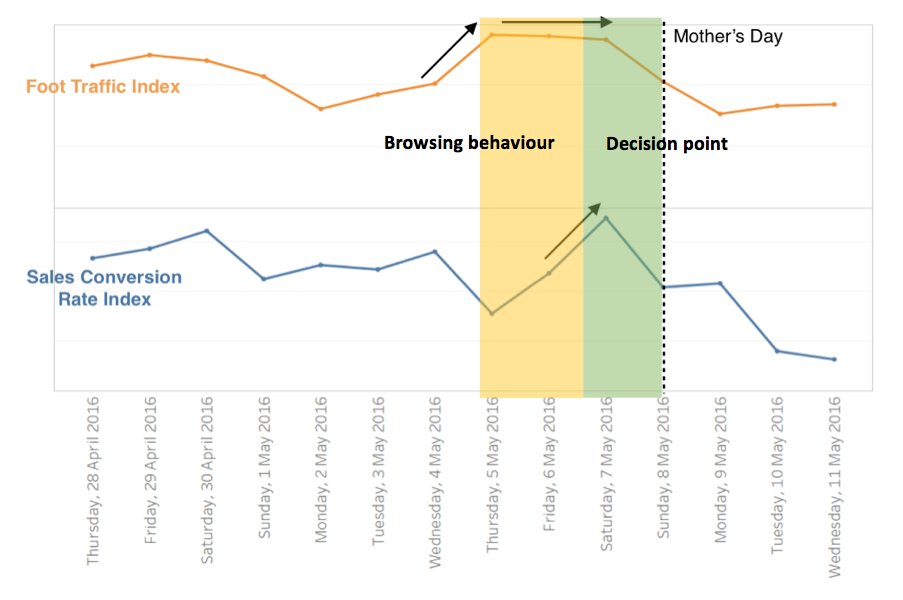 Figure 1.1b Sales Conversion Rate and Foot traffic Index before and after mother’s day 2016.
Key operational insights for Mother’s Day:
-
Retailers should consider increasing rosters on the Thursday and Friday leading up to Mother’s Day to convert shoppers to sales or at least capture their interest prior to their purchase decision.
-
There is an opportunity to design promotional activity around converting shoppers on Thursday and Friday. Once these shoppers are converted they essentially have made their purchase prior to Saturday. Retailers would have then been successful in encouraging shoppers to make the decision earlier and reducing the situation where they will transact with a competitor.
For more detailed observations and findings, please read on:
-
2017 shopping behaviour mirrored 2016 for Mother’s Day Sunday where sales surged on the Saturday driven by an increase in foot traffic and sales conversion rates (Figure 1.1a, Figure 1.1b).
-
However, foot traffic volumes increase to Saturday levels when the purchase was made on the Thursday and Friday (Figure 1.1a, Figure 1.1b).
-
The above findings indicate that a high volume of shoppers typically begin browsing for gifts on Thursday and Friday, with the final purchase decision being made on Saturday.
-
Other data points for reference include a percentage breakdown of sales from Thursday leading up to Mother’s Day Sunday:
-
Saturday captured 35% of total sales in the four-day period (Figure 1.2).
-
But only had 28% of foot traffic.
-
-
We also found that Average Transaction Values remain steady during this period (Figure 1.3).
-
With a state-by-state breakdown (Figure 1.4), we have also observed that Queensland experienced the largest increase in shopping centre foot traffic before Mother’s Day Sunday while Tasmania experienced the lowest dip on Mother’s Day.
-
Looking further into the future, national Google search data indicates that Australian interest in Mother’s Day reached an all time high in 2016 and dropped slightly in 2017 (Figure 1.5). Although this is a minor shift, if this trend continues is could indicate weaker Mother’s Day trading in 2018 and beyond.
We will monitor this and other indicators closely in the future.
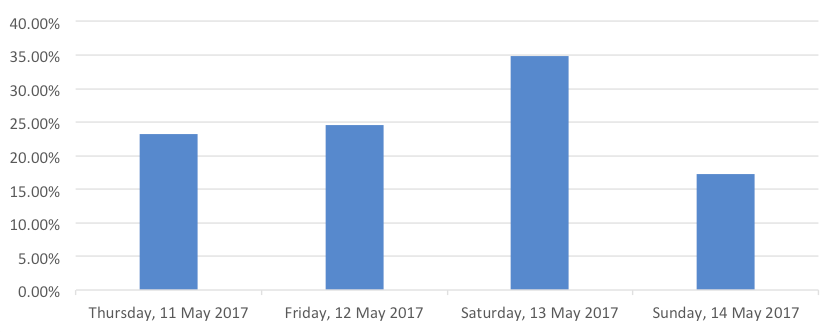 Figure 1.2 % of sales revenue for 2017 mother’s day sale.
 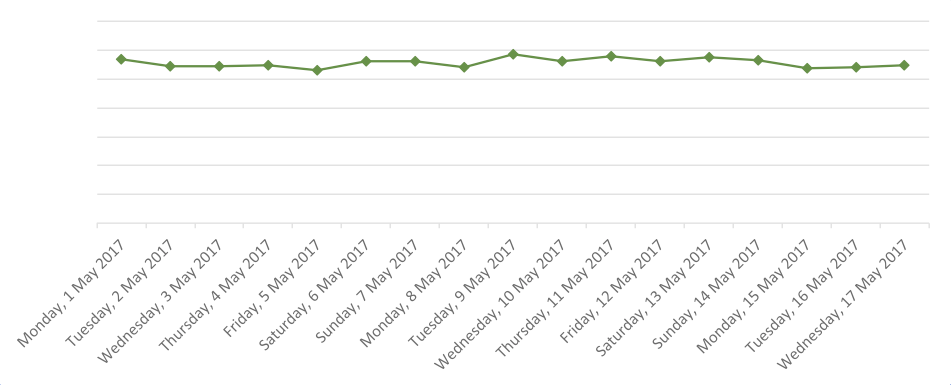 Figure 1.3 Average Transaction value Index before and after mother’s day 2017.
 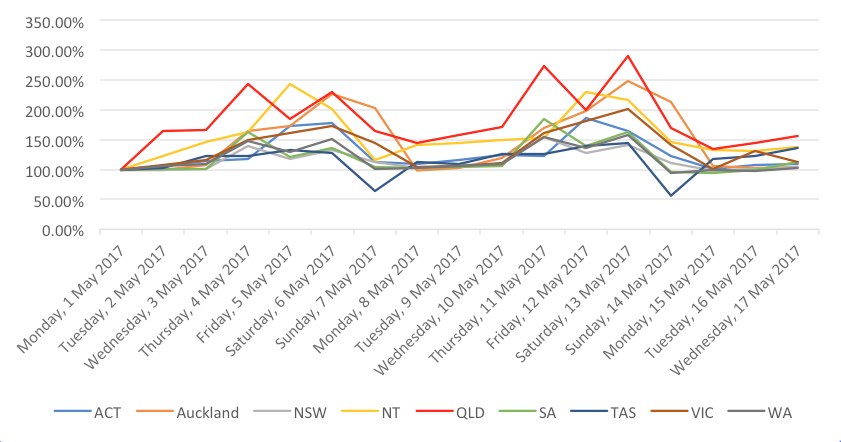 Figure 1.4 Foot traffic Index before and after mother’s day 2017 per region.
 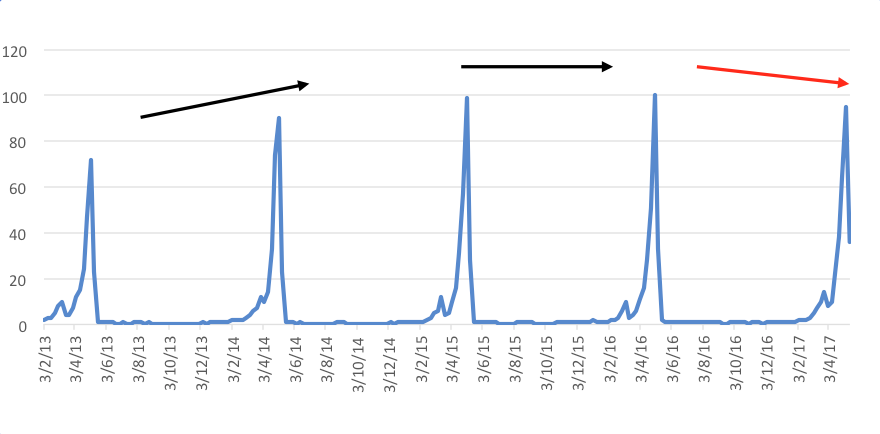 Figure 1.5 Mother’s Day interest over time in Australia in the past five years.
Reference: Google Population Sentiment Analysis, as of 22 May 2017.
The Kepler Retail Radar was prepared by Miley He, Lead Data Scientist at Kepler Analytics.
For more information about the data or any suggestions for future Retail Radar topics, please contact us directly:
David Gordon
Executive Director
E: david.gordon@kepleranalytics.com
M: +61412 324 849
David Mah
Chief Executive Officer
E: david@kepleranalytics.com
M: +61430 021 355