
Introduction
Kepler Analytics is in a unique and privileged position. We have our sensors in over 60 retail brands within 1,700 locations across Australia. We collect traffic and other consumer behaviour measures. Our clients provide us with their daily sales budgets, actual POS sales and often a number of other measures on which they manage their businesses.
By aggregating and anonymising our information we can provide the retail industry with benchmark measures on traffic, sales, conversion and other related KPIs focussed on understanding sales and the drivers of retail sales.
The Kepler Retail Radar newsletter is published every 6-8 weeks. We try to keep our analysis relevant and deliver helpful insights which assist in understand historical performance but also highlight where learnings can be implemented to deliver better retail results in future.
Throughout the December trading period, there have been consistent areas of interest expressed by retailers:
-
Has consumer behaviour changed this December especially with the impact of online sales?
-
What was the pattern of trading across the second half of December 2018.
We have addressed these questions as follows:
-
Consumer behaviour
-
Outside traffic (shopping centre visitors) numbers and daily patterns
-
Conversion to Inside traffic (in-store)
-
-
Trading patterns have been analysed with data in mind
-
Compared to Last Year (LY) and across each of the days in December 2018
-
Sales $
-
Transaction numbers
-
Average Transaction Values (ATV)
-
-
-
Retailer performance
-
Sales $ compared to Targets (budgets)
-
Sales compared to LY
-
In this analysis Kepler will analyse the trends and daily variations to provide retailers with a view of overall Australian retail sales performance in December 2018 and seek to identify the sales drivers which most affected this performance.
Key assumptions to be tested:
-
That there has been a reduction in traffic in the shopping centres and has this contributed the lower sales?
-
There has been a change in the daily pattern of shopping centre traffic where consumers are shopping later and trade is more consolidated into a smaller period before Christmas?
-
Retailers have correctly distributed their daily sales targets across December 2018 given the key trading dates (Christmas, Boxing Day and New Year’s Day) were on different weekdays compared to last year
For this analysis Kepler has used data from two sources:
-
The weekly Kepler Retail Index* (KRI)
-
At a more detailed based level, from aggregated data across all Kepler retail stores which were open during December 2017 as well as December 2018 (LFL)
All stores used in this analysis are absolutely comparable as they comply with the criteria of trading across both 2017 and 2018 during the periods analysed.
Kepler Retail Index* KRI
This is based on the stable Kepler Panel of 324 stores across 194 shopping locations across Australia. Kepler clients have daily access to this data via a web based dashboard.
The KRI is updated weekly and provides Users with a view of changes compared to the previous week and/or weekly measures indexed on the first period a user selected.
The KRI is broken down into Australian States, different location profiles (eg. A Metro Shopping Centres, Strips, Factory Outlet Centres, etc) and 36 individual shopping centres (where there are a minimum of 5 stores with the Kepler system installed).
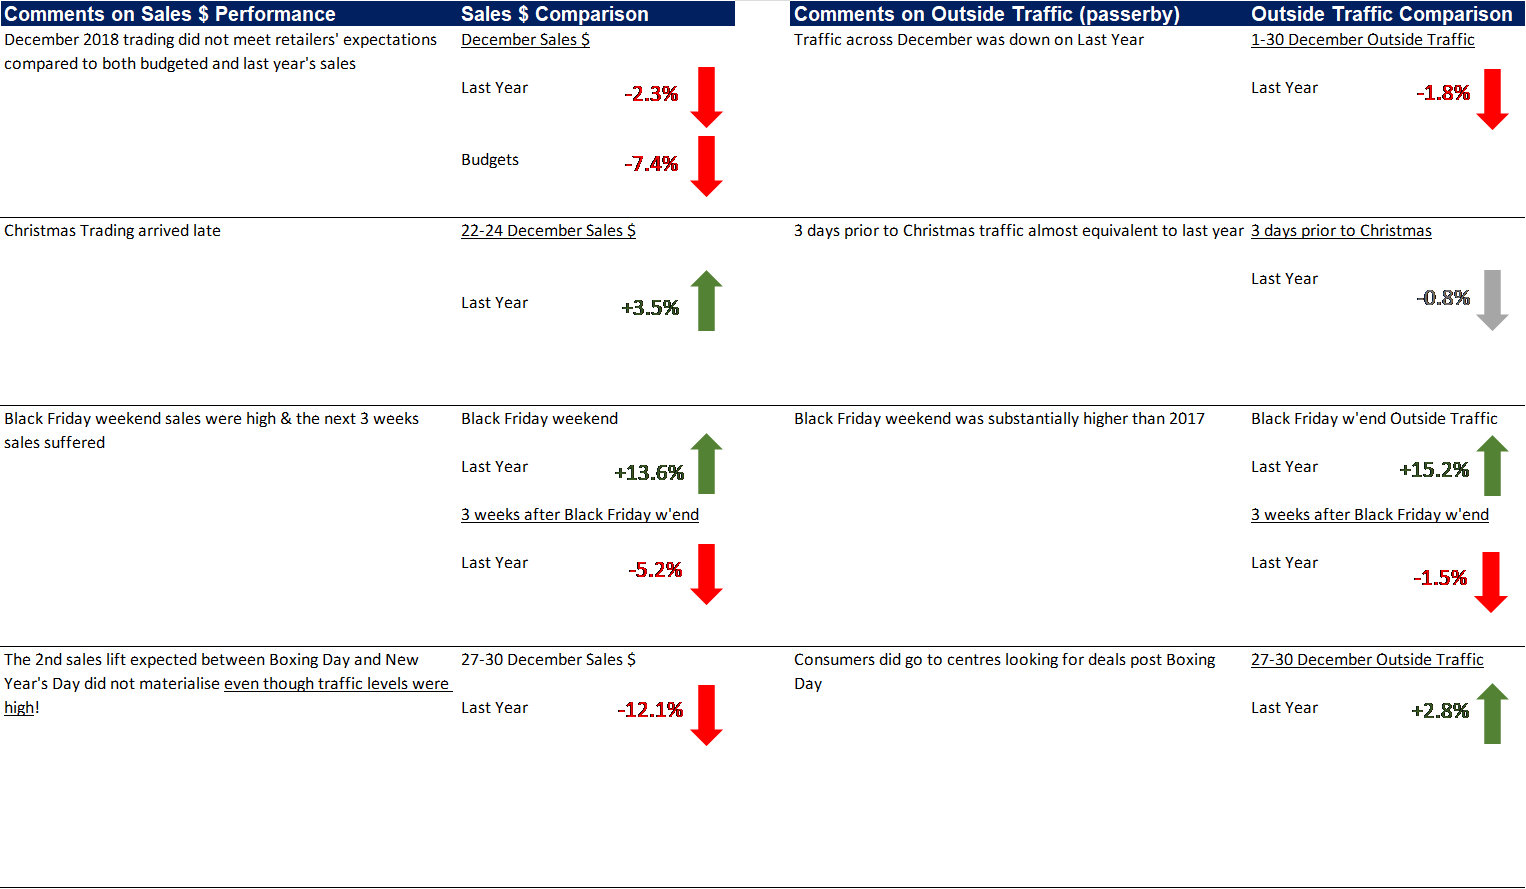
Top Line Findings
December Sales $ 2018 were 2.7% down on December 2017 and 7.4% on budgets
This was in part due to Outside Traffic (passers-by) being down by almost 2% compared to 2017
Black Friday weekend showed very high sales driven by a large comparative increase in traffic. This affected the 3 week trading period immediately after the Black Friday weekend where traffic and sales were down.
Christmas retail demand was late with the 3 days prior to Christmas showing an increase of 3.5% on the same 3 days last year. The addition of an extra Monday’s trading (remembering Christmas was on Tuesday this year and Monday last year) was positive. Kepler had forecasted an additional 3.2% of sales due to the ‘additional Monday’.
The expected uplift in sales $ post Boxing Day was not as pronounced as 2017 even though traffic exceeded last year. It appears from other data that retailers did not have sufficient staff or stock levels or both! Anecdotal evidence suggests that retailers were concerned about lower December sales and margin pressures and so might have tightened up on wages and supply chain movement costs.
Outside Traffic in December 2018 was 1.8% below 2017 levels (compared to sales down 2.7%)
The decrease in traffic occurred up until the 22 December and there was a period of prolonged reduced traffic after the highs associated with the Black Friday weekend.
The expected increase in traffic after Boxing Day as consumers went ‘shopping the deal’ did eventuate but retailers did not see the subsequent lift in sales (see above).
Below are the comparatives of sales and outside traffic which will provide retailers with indications of the relationship between the two measures and verses last year.
Table of summarised key measures:
Learnings
-
Ignore Black Friday weekend at your peril – plan for effective store promotions, effective signage & windows.
-
The period post-Black Friday will result in lower foot traffic – budget accordingly, consider other sales strategies.
-
Ensure that rostering & stock are sufficient for post-Boxing Day period – treat as an important separate promotional period.
-
Maintain a central focus on Sales Conversion/Upselling training for store level staff – this will optimise traffic opportunities & subsequently reduce the pain of lower traffic numbers through increased conversion.
-
Keep a focus & pressure on shopping centre landlords to deliver traffic levels!
Retailers Sales for 1 December 2018 to 1 January 2019 were -7.4% lower than their sales $ targets!
Across the 32 days including the key public holidays, Kepler retailers’ sales performance is more than -7% lower than budgets. But the pattern of trade was very different to that expected by retailers (see below).
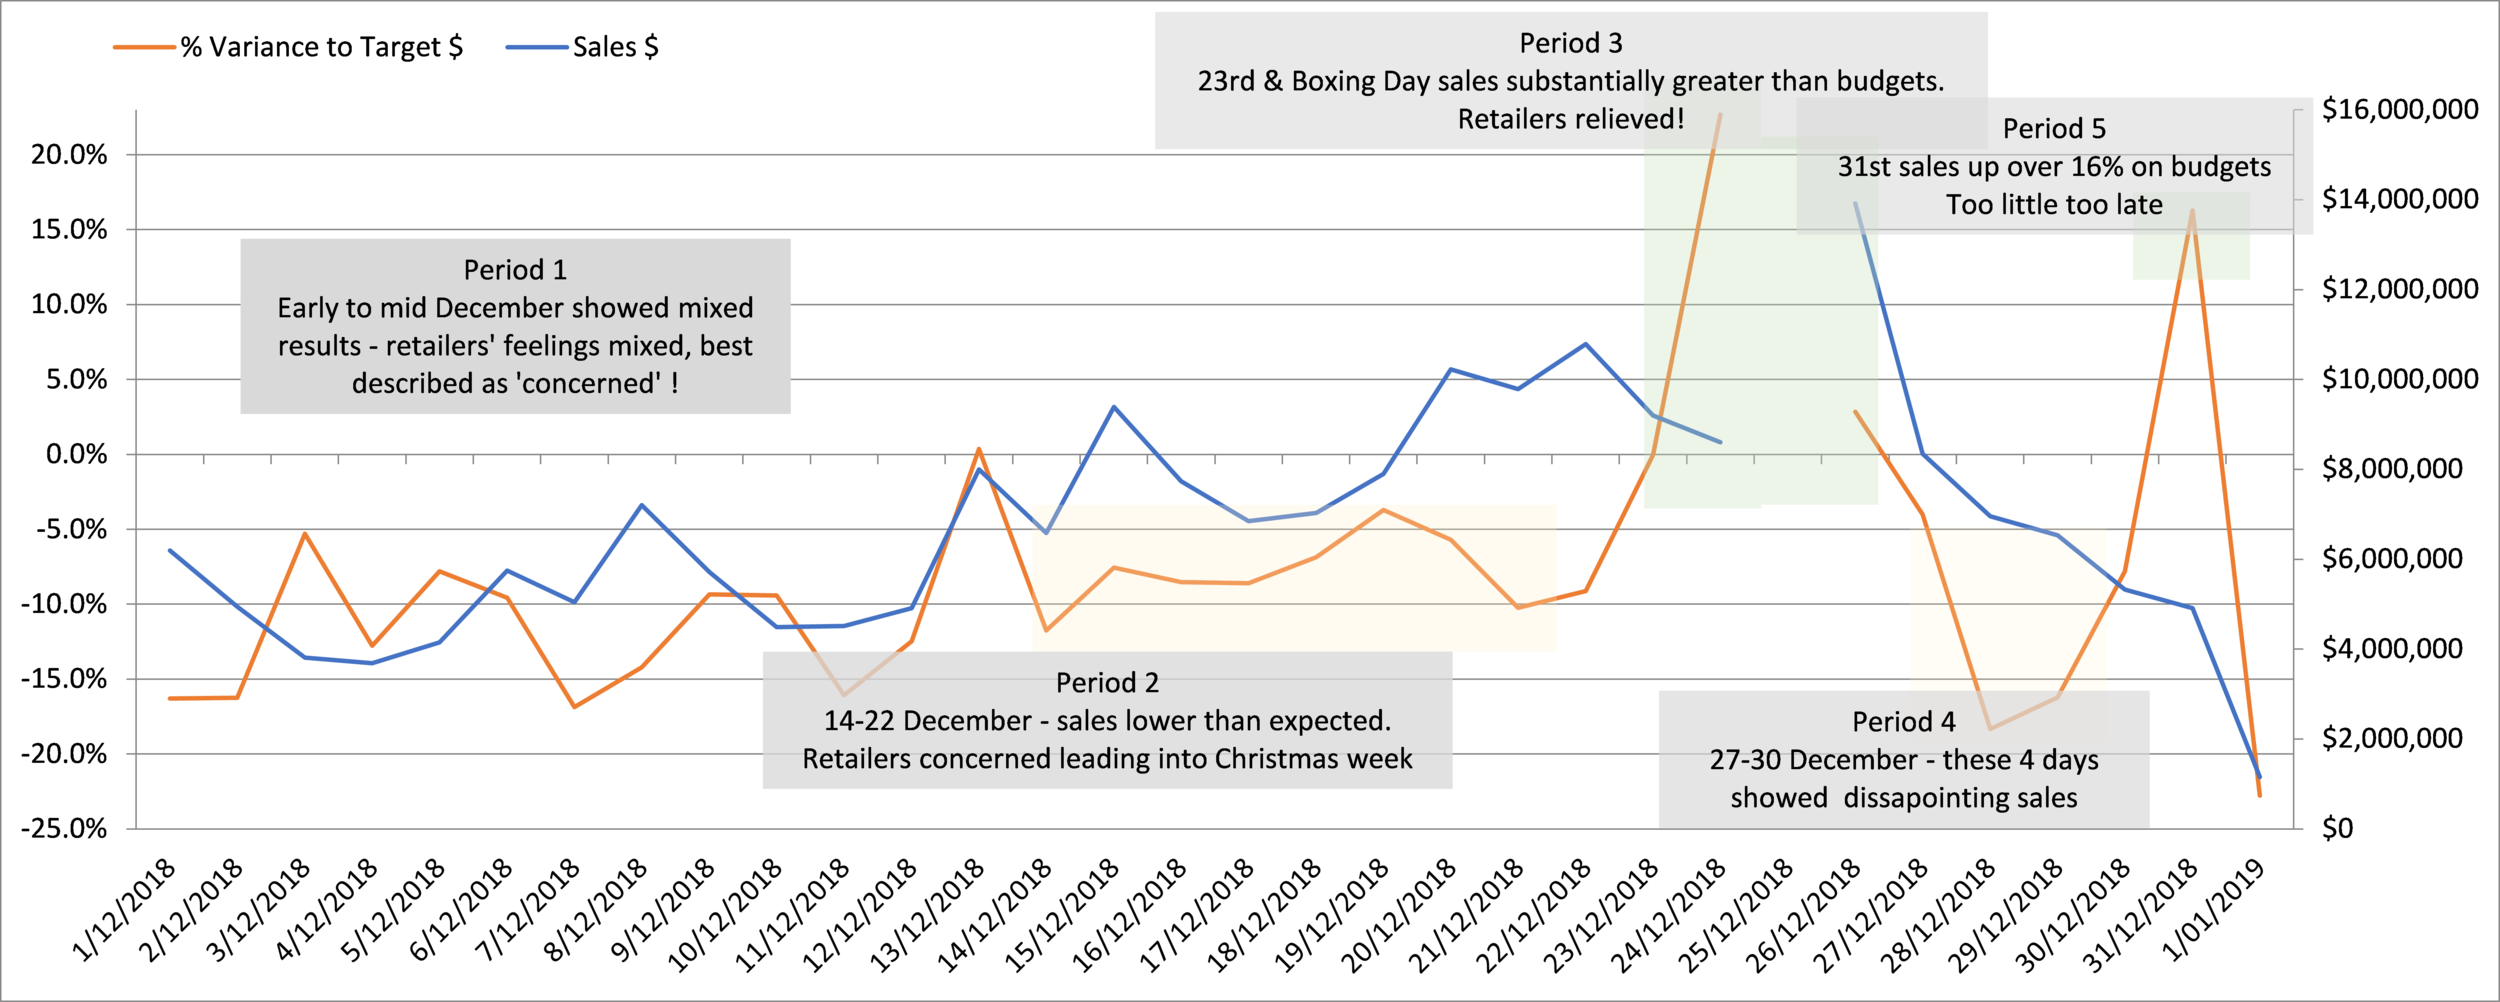
Kepler has defined the December trading month into five specific trading periods – ‘the emotional rollercoaster’.
Period 1 – Confusion 1 December – 13 December
——————————————————————————————————————
-
Trading patchy compared to budgets
-
Generally, not achieving daily targets
-
There was a level of apprehension about what this was indicating regarding Christmas trading
Period 2 – Major Concern 14 December – 22 December——————————————————————————————————————
-
Closer to Christmas and trading was soft compared to budget and to same period last year (LY)
-
Apprehension that Black Friday and Click Frenzy had affected pre-Christmas traffic and customer buying patterns (see analysis later)
-
There was a real level of stress and concern for what Christmas will deliver
Period 3 – Relief 23 December – 26 December——————————————————————————————————————
-
Major uplift in sales especially in the 3 days prior to Christmas compared to budgets
-
Boxing Day was slightly up on budget expectations as well
-
Retailers benefited from customers holding back and purchasing last minute before Christmas
-
Relief was the overriding emotion
Period 4 – Disappointment 27 December – 30 December——————————————————————————————————————
-
The expected deal hunting at post Boxing Day sales did not meet expectations
-
Many retailers extended promotions and introduced unplanned for ‘% off already discounted’ products
-
Concern about major hits to Gross Margins
Period 5 – Too little too late 31 December——————————————————————————————————————
-
The last day of the year exceeded expectations
-
A better day compared to budgets, but too little, too late
-
The only other comment is that retailers seem to have set ambitious targets this year – LfL would be an interesting comparison (see later)
When compared to 2017, December 2018 trading shows three observations: that Black Friday weekend had a substantial impact on comparative December trading; the Christmas rush came very late between 22-24 December; and Boxing Day trading was weaker than 2017.
Overall December 2018 sales were -2.7% down on 2017!
The 2018 Black Friday weekend outperformed 2017 by almost 14% (1) and daily sales levels were, incredibly, similar to the level of the 27, 28 & 29 December – where the traditional post-Christmas deal shopping takes place. Ignore Black Friday and Click Frenzy 2019 at your peril!
This ‘mini Christmas’ or some were calling the ‘early Christmas’ had a marked negative effect on the next three weeks trading when compared to 2017. Retailers who were not ready for Black Friday or who did not promote effectively not only missed the upturn in sales during that weekend but were affected by the subdued trade in the period thereafter.
The Saturday, Sunday and Monday prior to Christmas 2018 (2) were comparatively very strong sales days and these days were up 3.5% verse same days last year. Sales arrived late! Boxing Day disappointed, down 10.3% compared to 2017 (3) and then the bounce post-Boxing Day was not as evident as 2017.
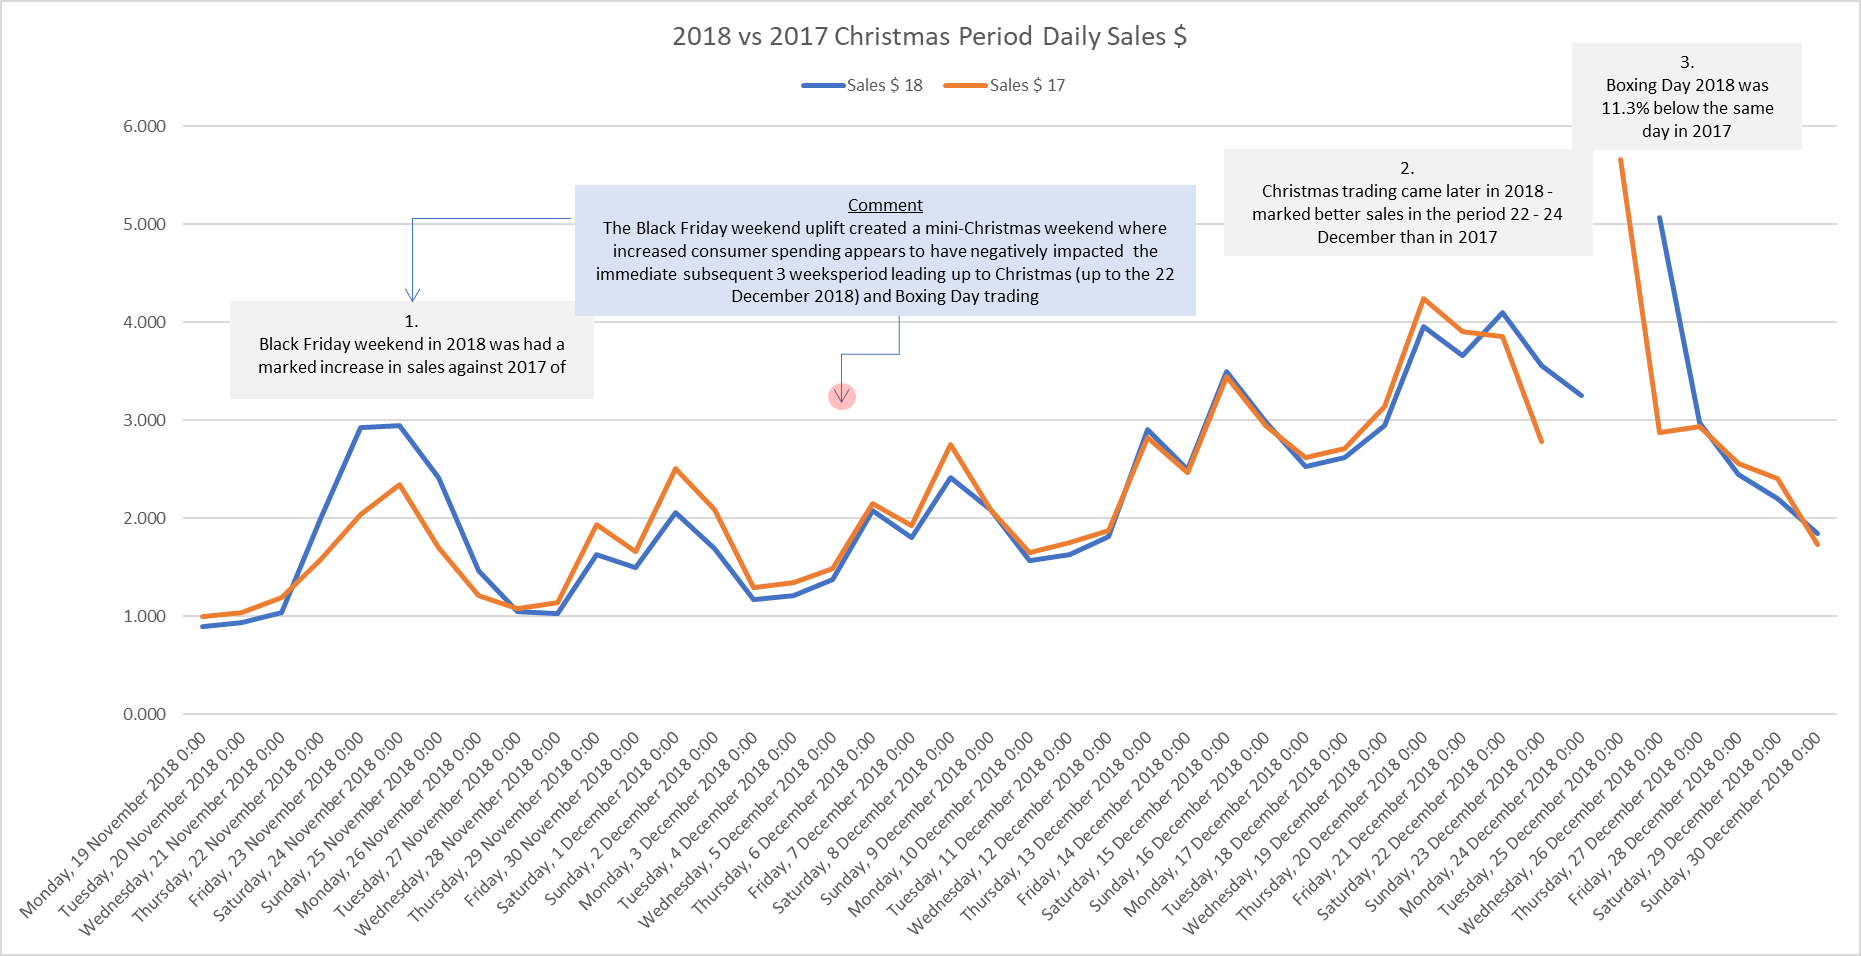
Over the remainder of this report Kepler will now endeavour to determine what the major drivers were affecting sales performance and these trading patterns.
Kepler retailers delivered in-store conversion improvement of more than 10% on standard levels but conversion levels settled back to standard levels after Christmas.
A key driver of pre-Christmas sales in an environment of lower traffic numbers was consumers’ intent to buy (1) and retailers’ focus to optimise inside traffic opportunities into sales transactions.
Post-Christmas these conversion rates reverted back to normal levels (2) and this resulted in below average sales performance in this year’s post-Christmas period!
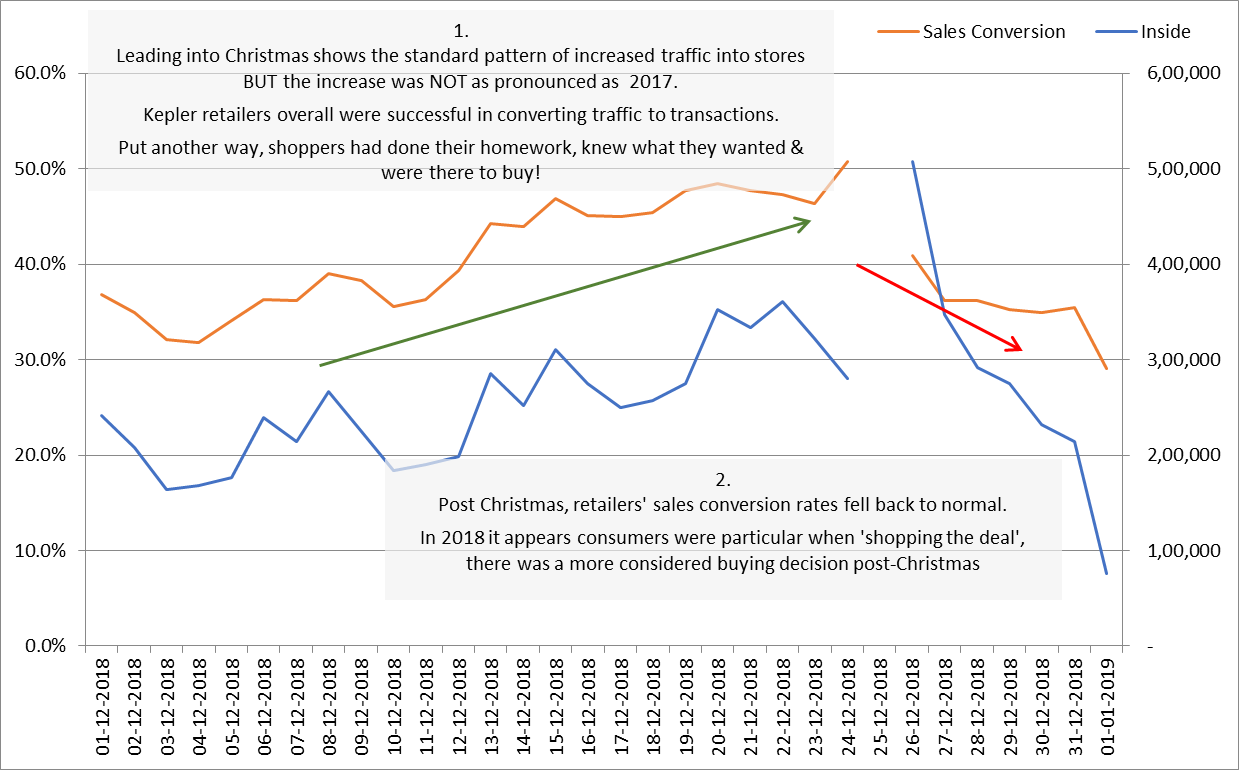
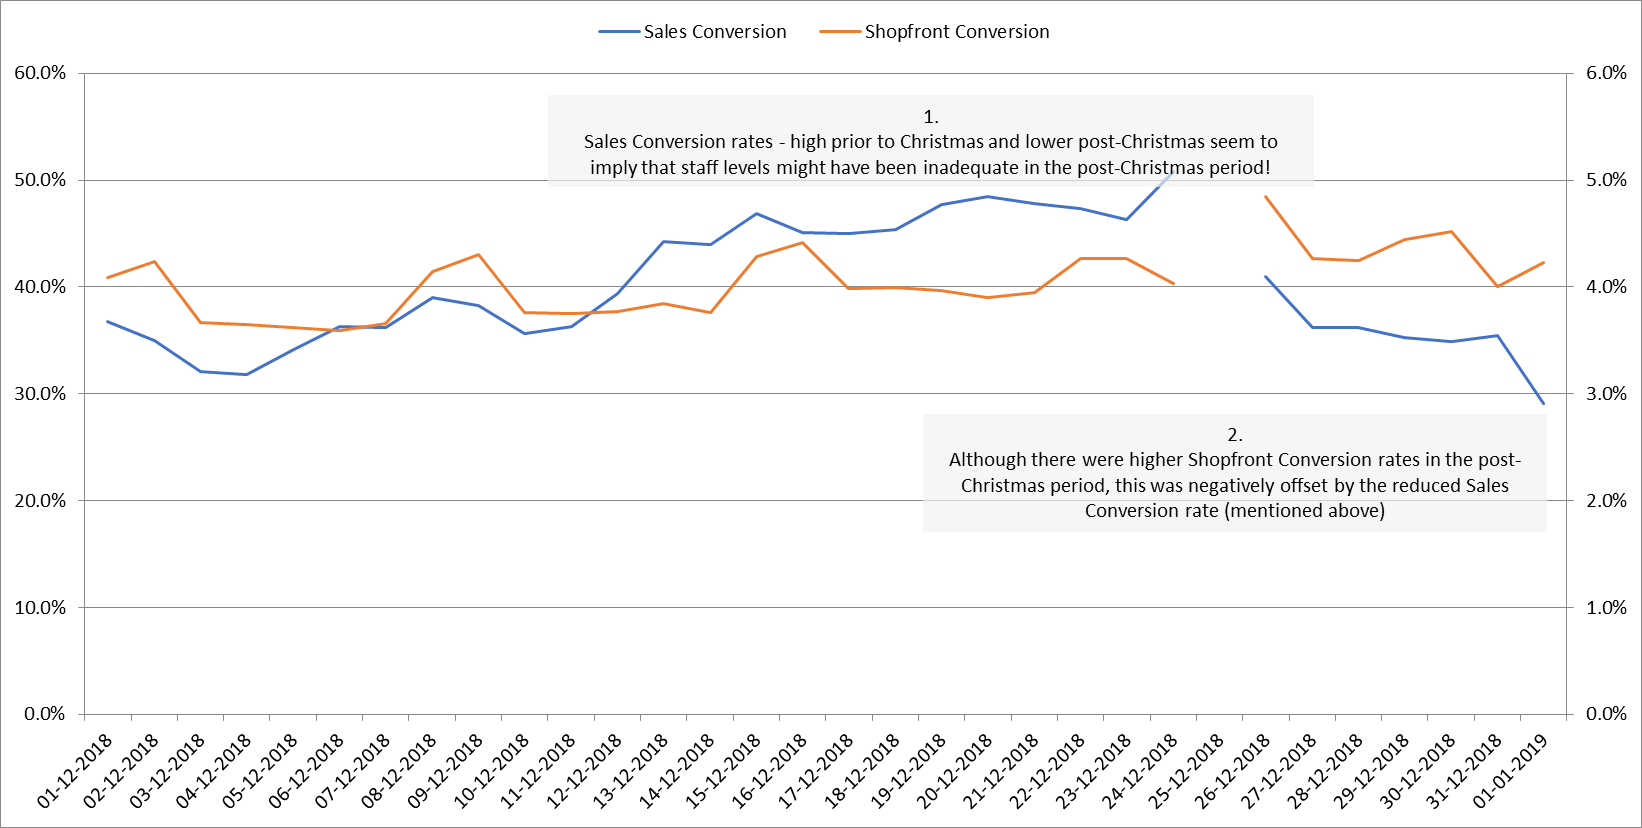
Reduced Sales Conversion post-Christmas could be viewed an indicative of inadequate staff or stock levels as Capture Rates (Shopfront Conversion) were high in this period.
In the build up to Christmas, consumer passer-by traffic (Outside) did not show increased inclination to convert to Inside Traffic (in-store).
Retailers were successful in converting Inside Traffic into sales. Sales Conversion rates grew from an average of 37% to over 50% on 24 December before Christmas (1).
This is in marked contrast to the period post-Christmas when there were fewer consumers and a lower conversion to sales rate (2). This lower sales conversion resulted in a poor sales period between Boxing Day and New Year.
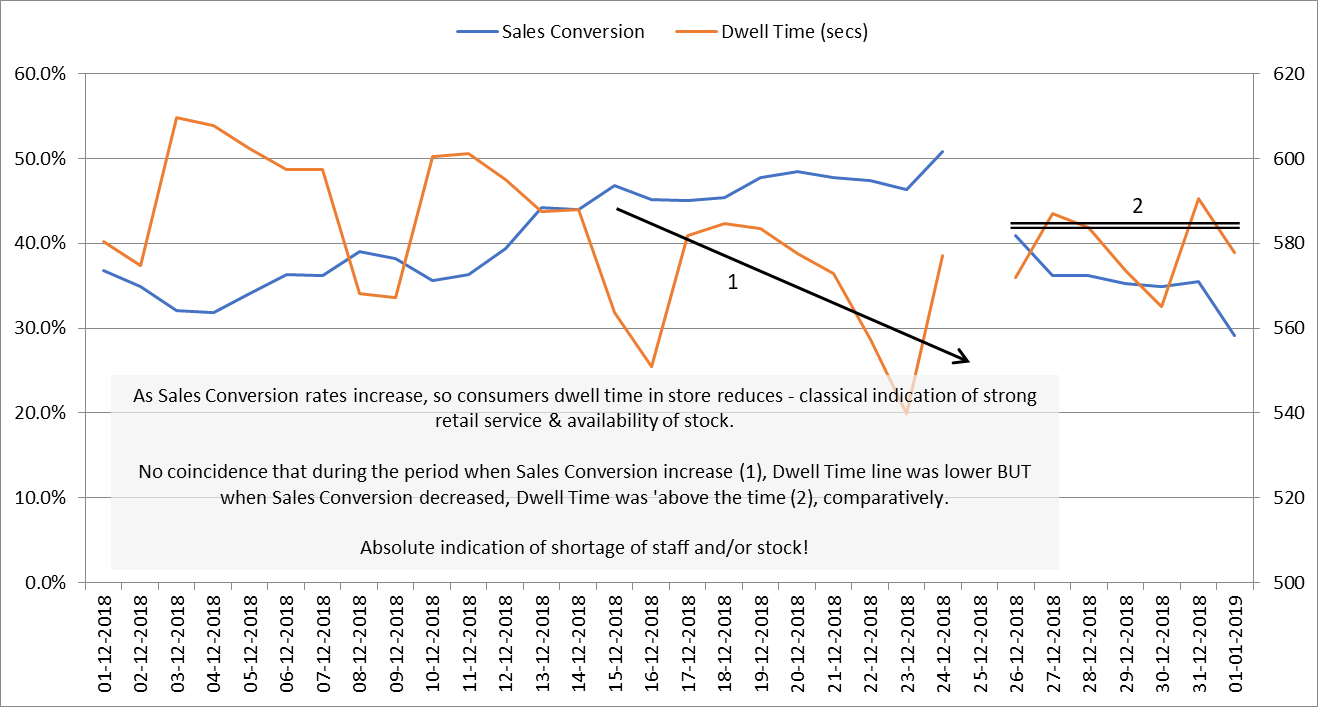
Further indications that a shortage of staff and/or stock impacted on the post-Christmas sales performance is seen in the comparable positions of Dwell Time to Sales Conversion rates in the high Conversion (1) verse low Conversion (2) periods.
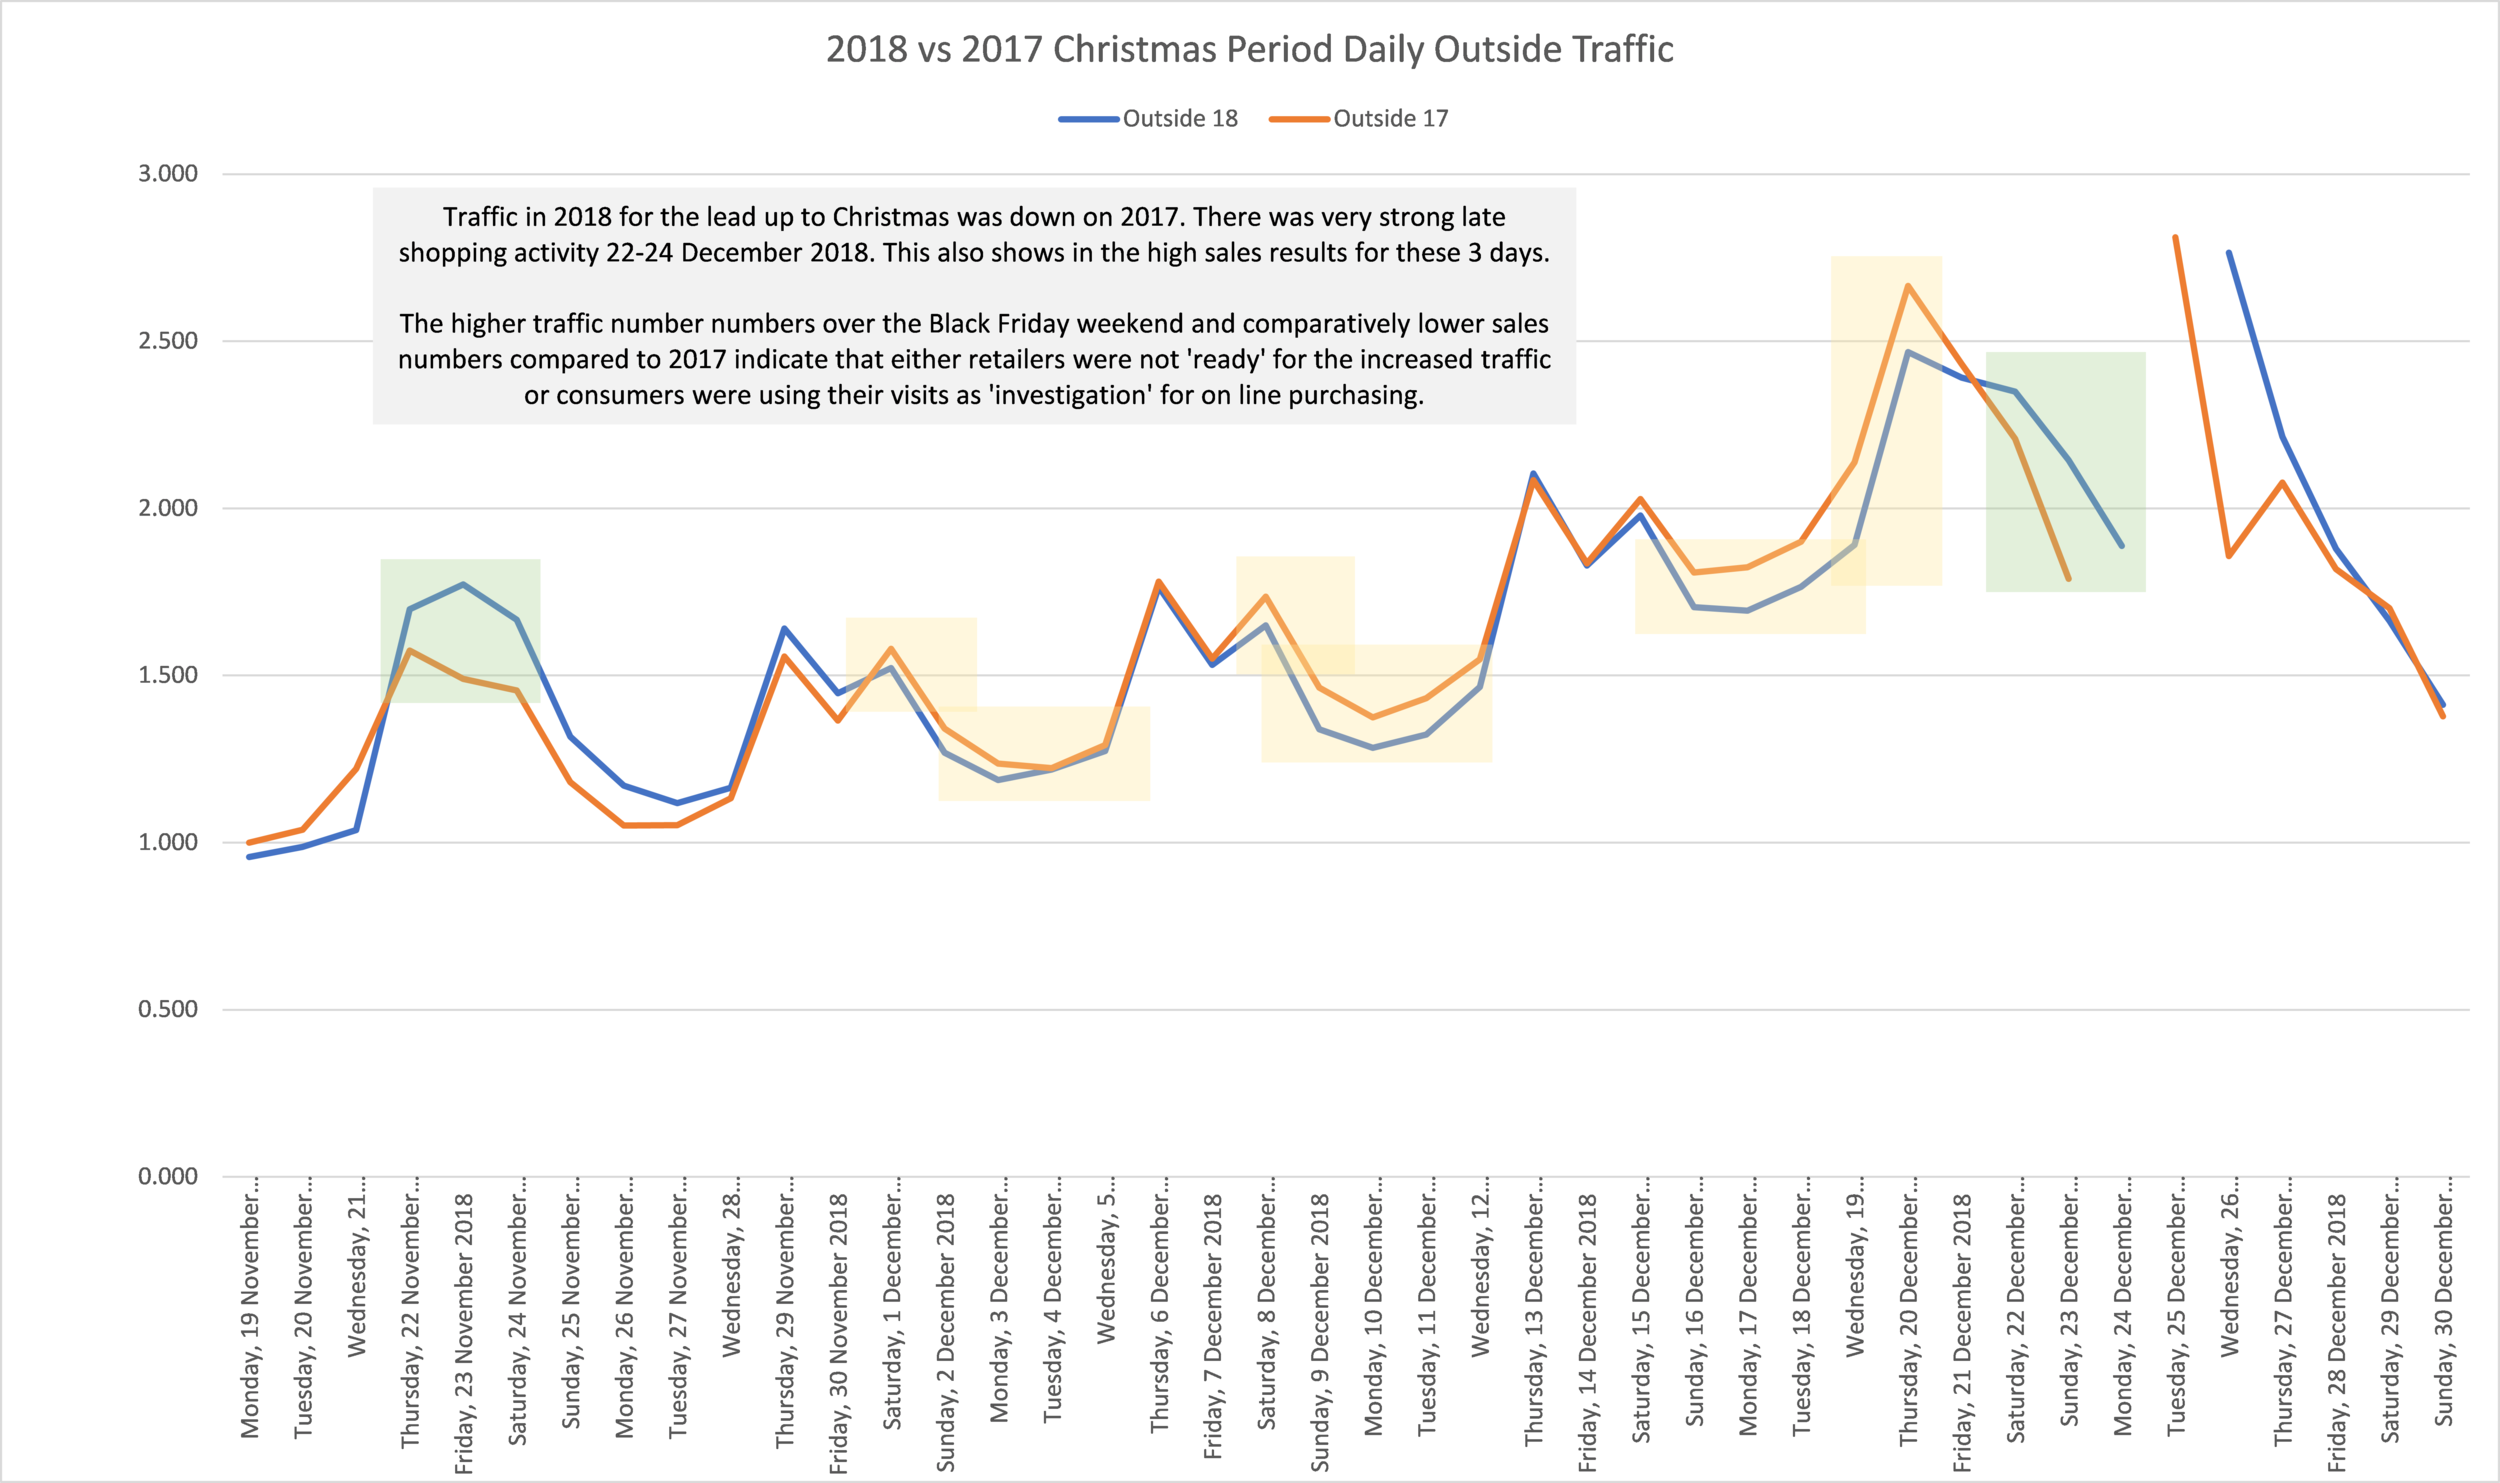
2018 traffic in the lead up to the 22 December and onwards period shows days of lower Outside Traffic (shopping centre visitors) compared to 2017. Retailers’ December 2018 sales were hit with this lower traffic and the impact of a very strong Black Friday weekend on early to mid-December trading.
During the two weeks leading up to the pre-Christmas weekend, most days resulted in lower Outside Traffic (centre traffic) than in the same period in 2017 (1). Despite higher conversion rates, this lower traffic impact on sales resulted in very subdued performance.
Only in the three days prior to Christmas Day did Outside Traffic exceed last year and this showed in better sales results for that period.
Disclaimer: The information within this document is based on information and data from Kepler Analytics and as such is our opinion. Please contact Kepler directly if you will be basing important business decisions on the data. This report is written as a general view of the Australian retail market in December 2018 and Kepler does have additional detail down to retail sector, geographic state and type of shopping centre location (large metro centres, strips, factory outlet centres, etc). Contact Kepler for further information.