Below is just a summary of our interactive KRI, If you would like to see its full capability, register below for a FREE Demo.
Click on the image to enlarge
Monthly KRI Summary
Discover key insights in the latest KRI (Kepler Retail Market Index) for the Month Ending 31st March 2024.
Store Traffic Bounces Back But Sales Conversion Falls in Q1 2024
- March has proved to be the most challenging month of calendar year 2024 for retailers, partly driven by weak Easter trade.
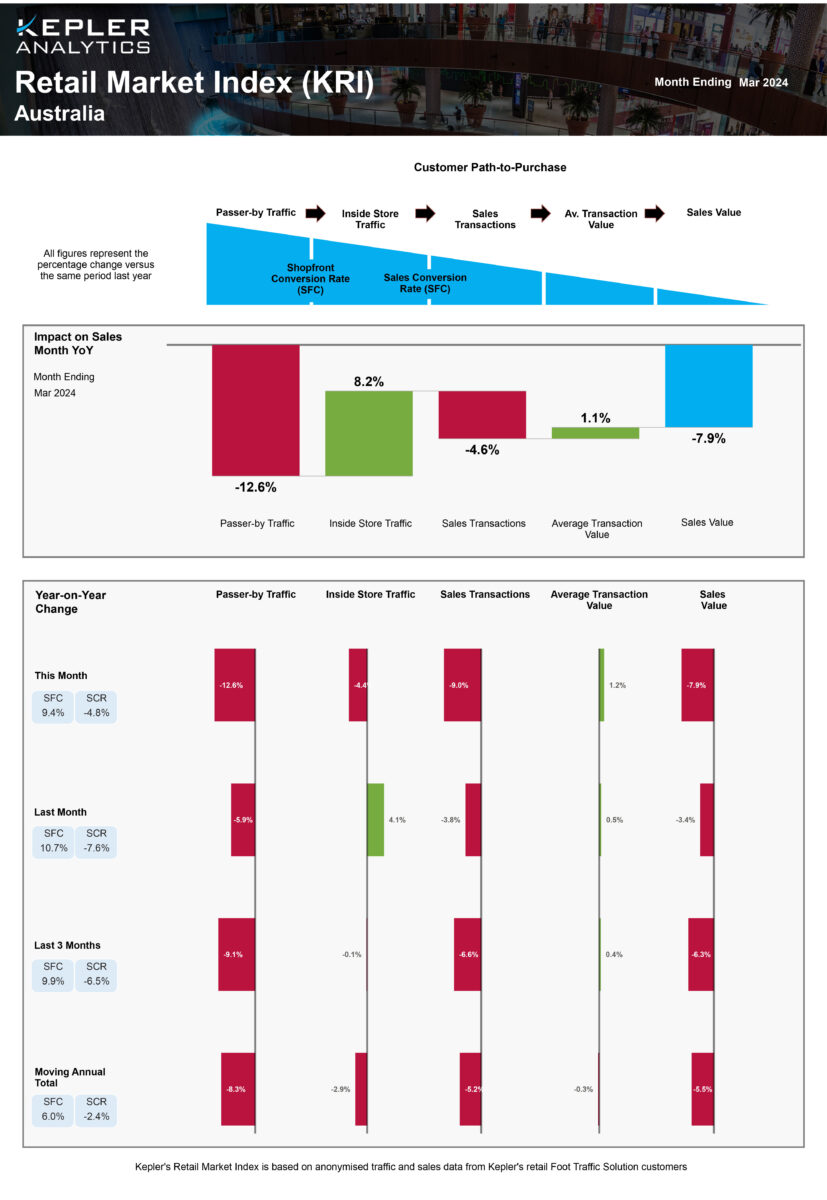
- March saw passer-by traffic down 12.6% and Inside traffic down 4.4% on last year. Sales conversion rates were more favourable than in January and February but were still down 4.8% on March last year. Sales were down 7.9% on March last year, higher than the declines seen in January (-7.0%) and February (-3.4%).
- However, there is a slight silver lining for retailers when we look across Q1. Inside traffic across the quarter is the same as Q1 2023 and is actually up 1.4% on Q1 2022. What is really hampering retailer performance is the falling sales conversion rate (percentage of Inside Traffic that makes a purchase). Sales Conversion rates have fallen by 6.5% compared with Q1 2023 driving a 6.3% decline in sales (sales are down 9.8% on Q1 2022)
- Our market sales forecast for Q1 2024 predicted a decline of between 1.0% to 5.4%. The actuals for January and February were in line with our estimates but a weaker than expected March drove a Q1 decline of 6.3% versus 2023, exceeding our pessimistic estimate by 0.9%.
- Our market sales forecast for Q1 2024 predicted a decline of between 1.0% to 5.4%. The actuals for January and February were in line with our estimates but a weaker than expected March drove a Q1 decline of 6.3% versus 2023, exceeding our pessimistic estimate by 0.9%.
- Comparing the week of Easter this year versus last year, the results are not what retailers were hoping for. Lack of foot traffic was the key issue. Passer-by traffic was down 16.9% and Inside store traffic was down 12.3% on the week of Easter last year. Lower Sales Conversion Rates were offset by higher average transaction values. As a result, the 12.3% drop in store traffic translated into a 11.7% drop in Sales.
- You will also notice we have launched a new look report. This report provides a more graphical view of the data and provides more insight into the longer-term trends. The top waterfall chart shows the impact each customer-path-to-purchase component has on the year-on-year sales result. The lower charts, show the year-on-year movements of each metric independently across different time periods.
Did you miss our webinar?
Get insights on Australia’s retail conditions by watching our first 2024 webinar. Danny French, David Mah, and Kylie Smart share detailed information on the Christmas and New Year trading conditions and the retail outlook for 2024.


