Download Full PDF Report
Key Insights

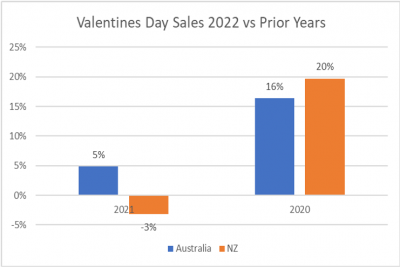
Valentines Sales have increased in Australia and New Zealand vs 2020 results.

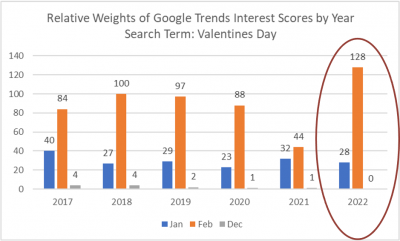
Shoppers search intentions are earlier in the year, with gifts for males being searched through January and February.
Searches for “Gifts for her” are left later, but there has been notable peaks in Feb 2021 and Feb 2022.

Centre traffic continues to improves but Inside (store) traffic lags as shoppers make ‘targeted visits’
Click on the image to enlarge
Summary of Valentine’s Day Performance
Sales increase of ~5% in AUS
Key insight
- Traffic levels have improved
- Targeted trips mean fewer store visits per trip
Sales are up (excluding Footwear 4.33% up)
- Number of sales are down for most categories
- Key driver is the reduced Inside Traffic
- But the amount being spent is higher
- Inflation and/or more items being bought
If your landlords are telling you ‘traffic is up’ – they are correct – throughout the centre BUT not for your location
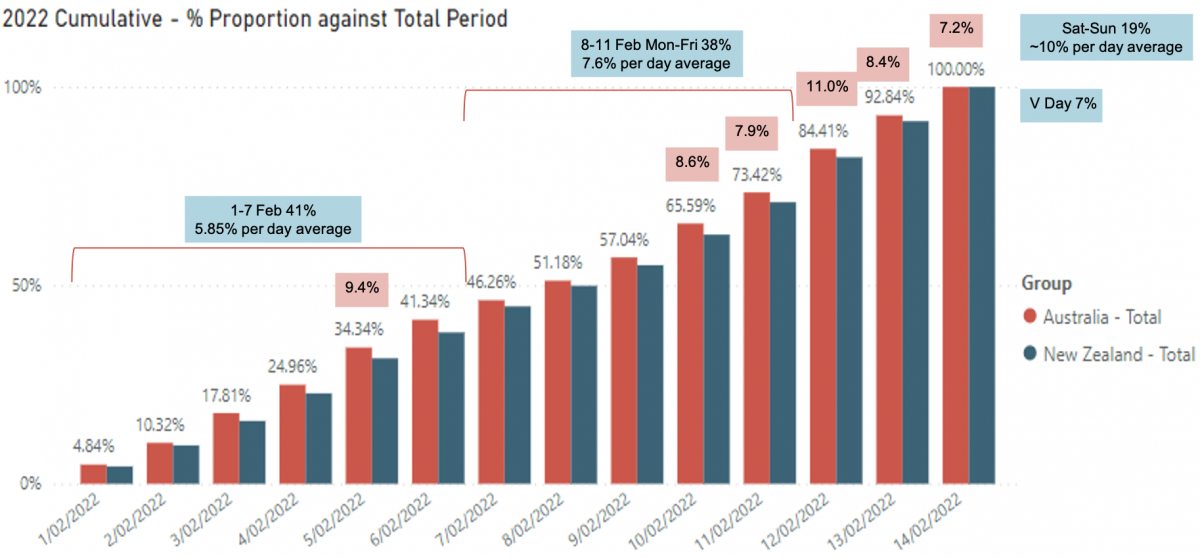
2022 Cumulative – % Proportion against total period
- 41% of the period’s sales in first 7 days
- ~27% in the last 3 days
- ~20% on Saturday and Sunday
- ~7% on V Day itself
Indications of Valentine’s Day Interest
Google Trends show a strong increase in Intentions this year


‘Gifts for Her’ substantially lower than ‘Gifts for Him’
USA v AUS/NZ Comparisons
- AUS lockdowns in 21’ and 20’ played significant roles in the sales comparative trend
- The USA did not have the nationwide depth of lockdown that we did


