![]()


Download Full PDF Report
![]()
In the week leading into Valentine’s Day is the 7th highest Sales $ week in the 44 weeks preceding November. Traditionally, Watches & Jewellery have dominated consumer spending during this week.
In 2021, General Merchandise and Electronics showed exceptionally strong Sales $ growth over prior years.
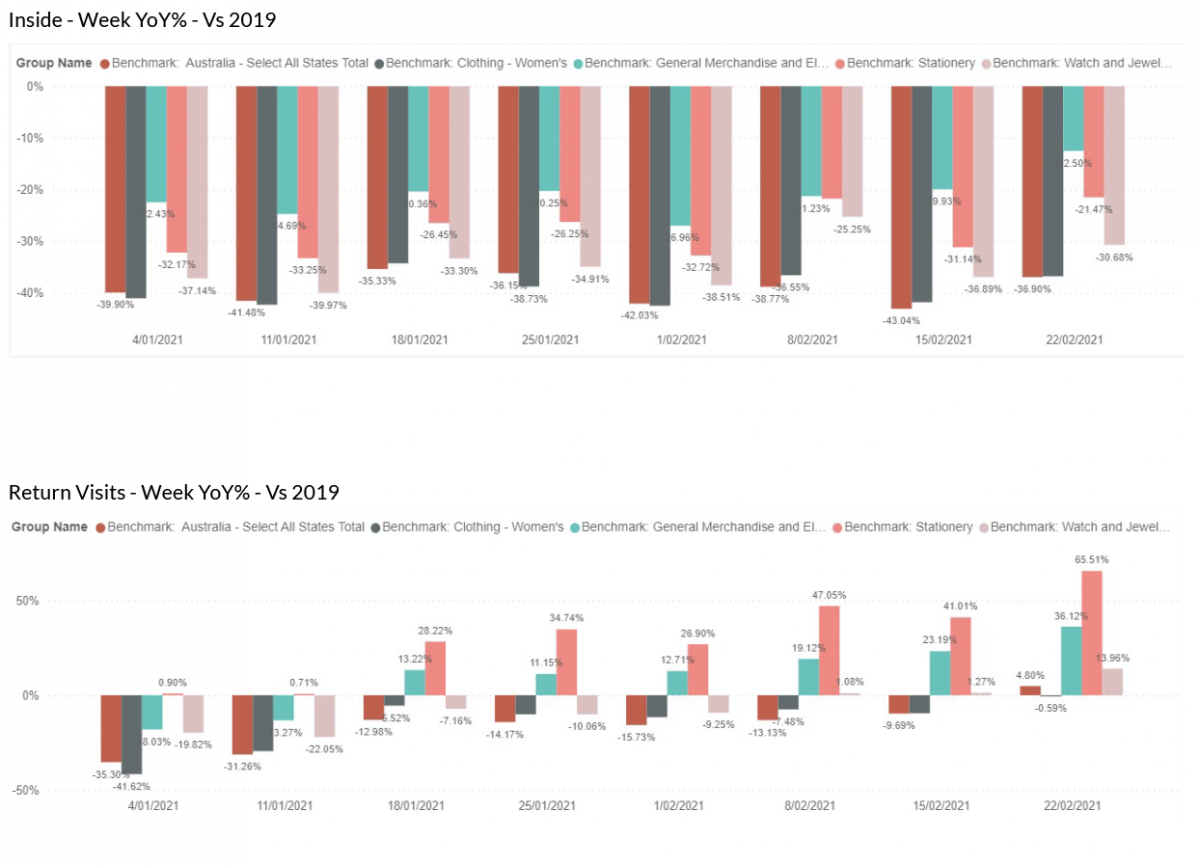
The key challenge to manage Inside Traffic levels is to elevate your brand’s relevance to your target market to increase repeat visits.
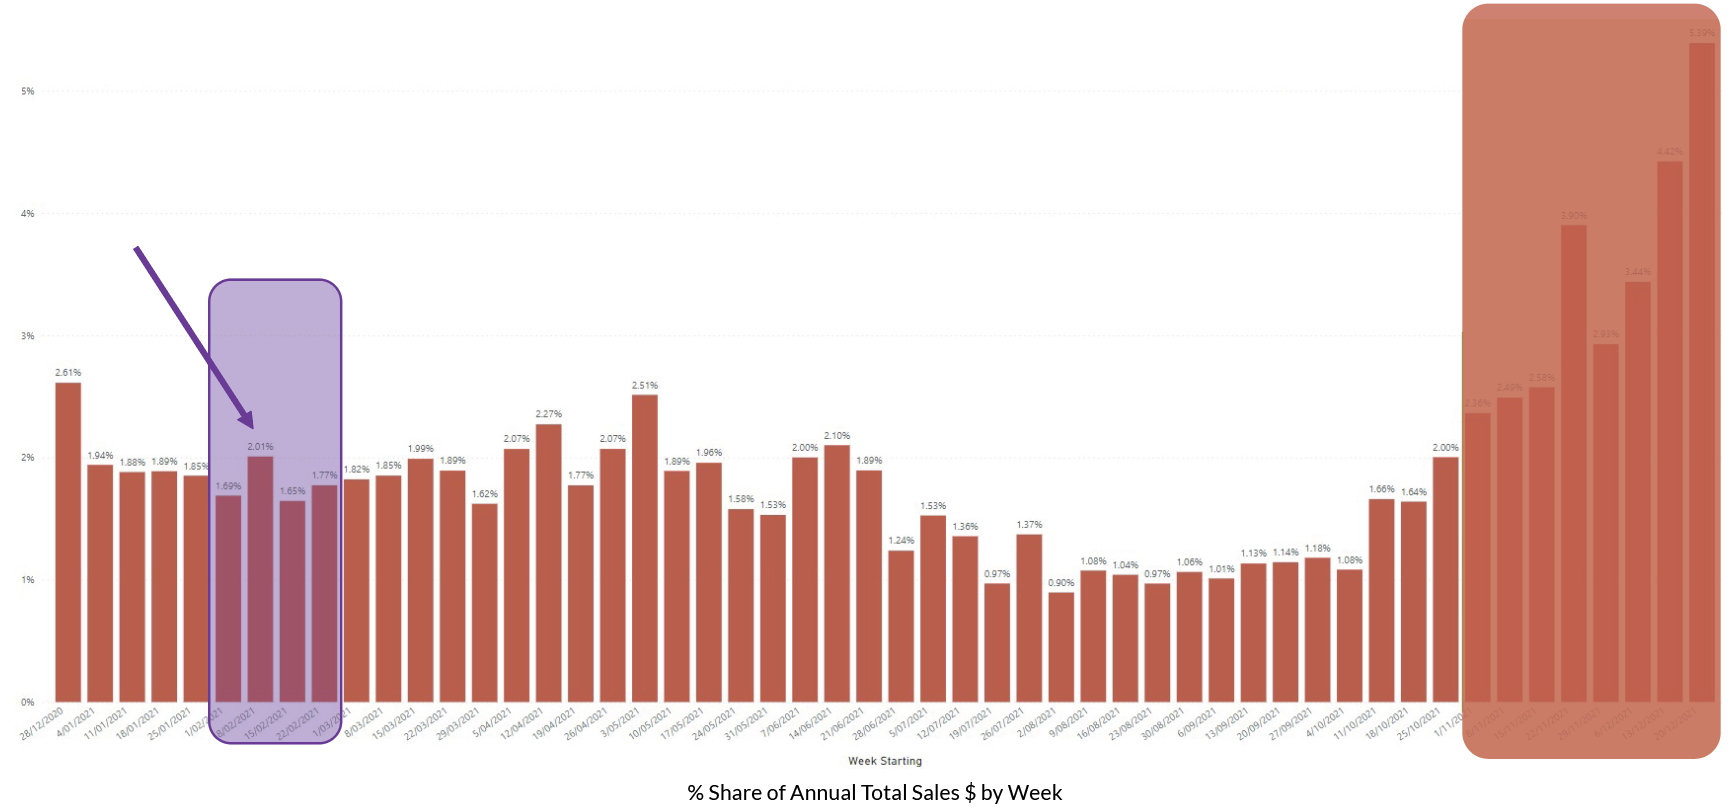
As a proportion of overall Sales $ generated by retail week, in 2021 February contributed 7.1% of all Sales $ – a fairly average result. The week immediately leading into Valentine’s Day contributed almost 30% of this share and is the 7th highest Sales $ week pre-November. Valentine’s Day, though short lived, is a lucrative contributor of Sales $ for the retail year.
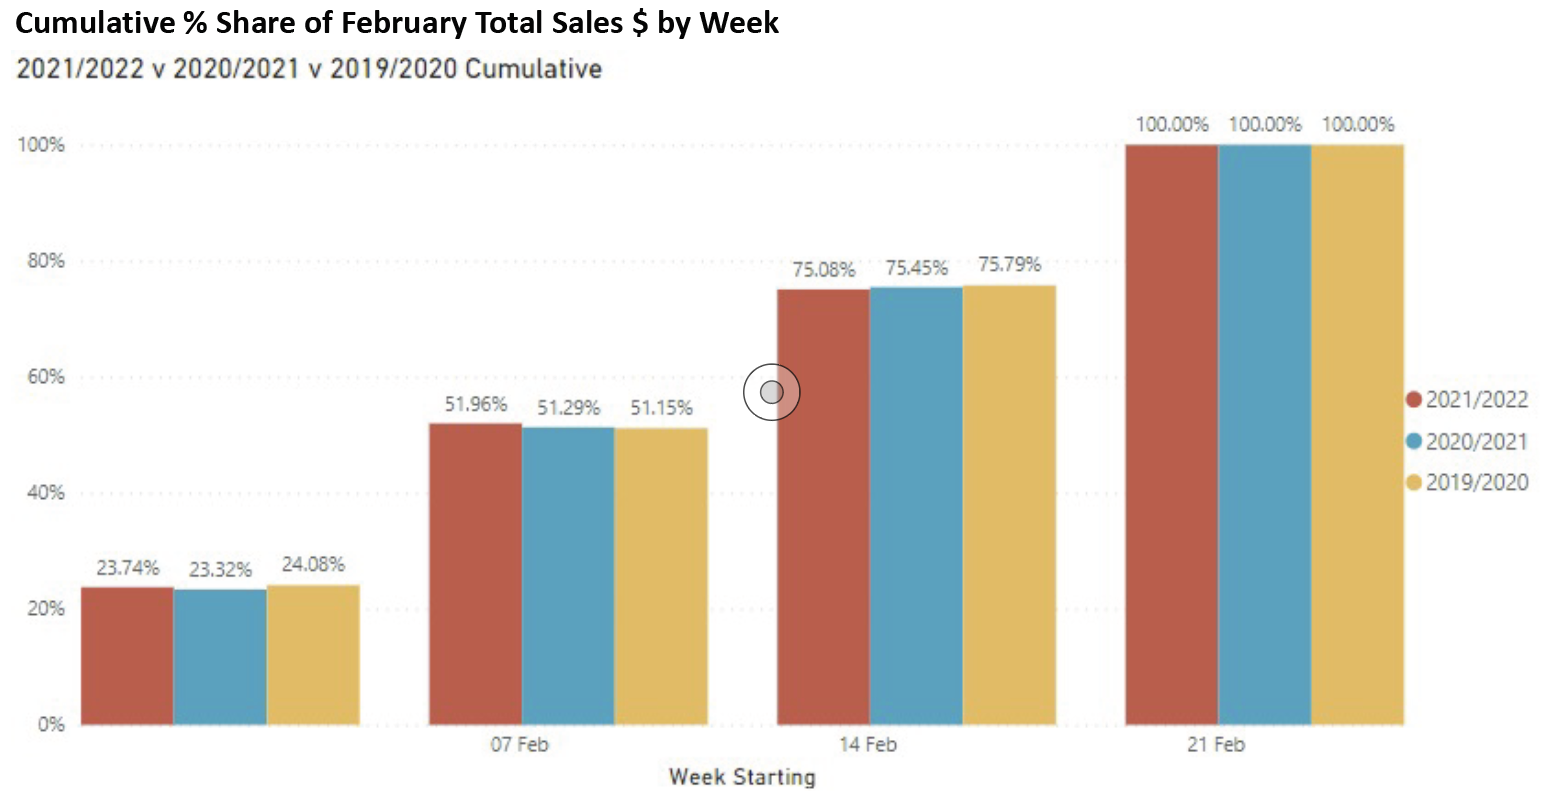
Over the course of February for the last 3 years, the pattern of sales across weeks has only marginally altered with most sales occurring before February 14th, but only just before. The Valentine’s Day spike occurs in the week leading up to, and the day of Valentine’s Day itself.
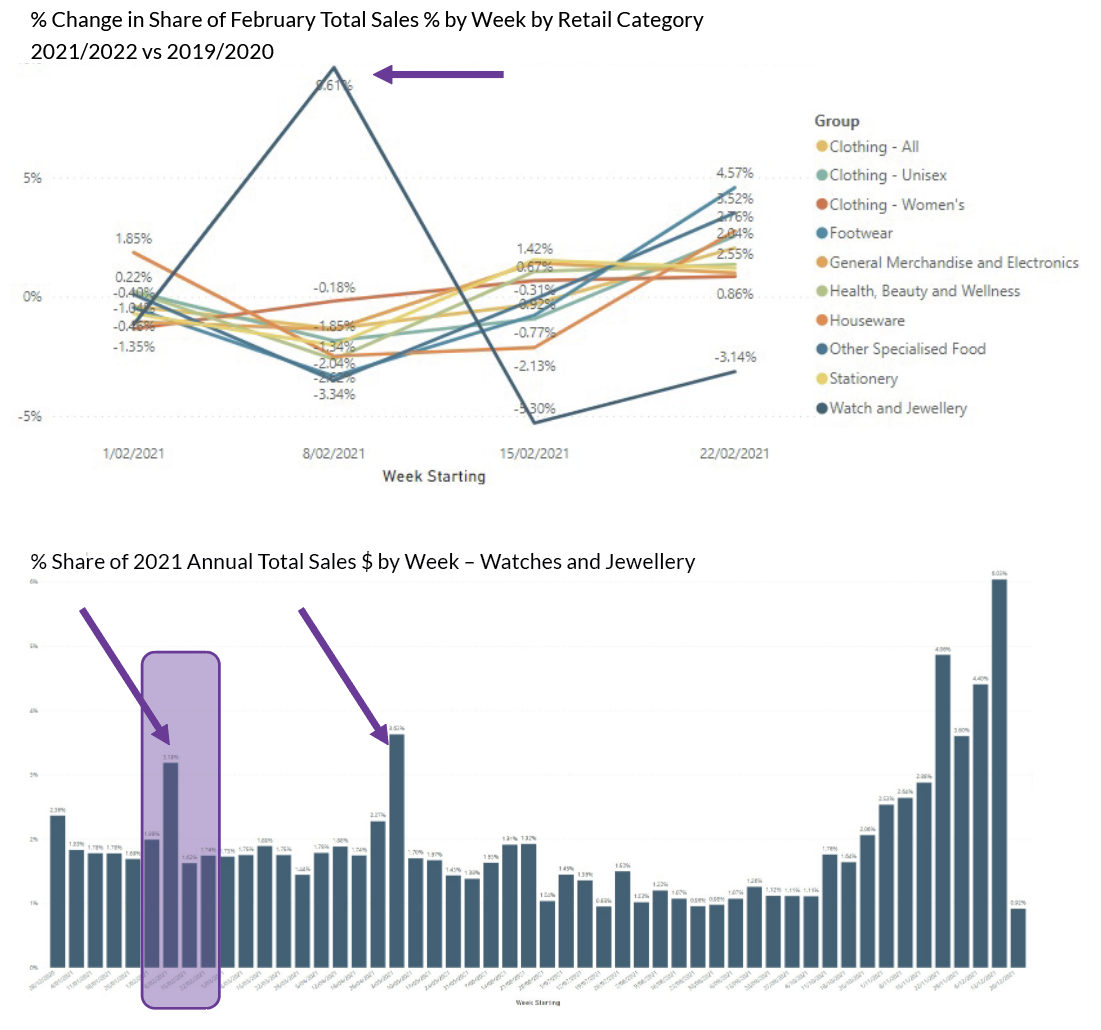
The most affected category has been Watch and Jewellery retailers, whose share of sales has jumped by almost 10% in the week leading into Valentine’s Day – capturing a larger share of the strongest week of the year. For this category, Valentine’s week is the 6th strongest sales week of the entire year. 3.2% of all annual Watch and Jewellery transactions will occur in this week, to generate 3.1% of annual Sales $.
It is worth noting that Mothers’ Day (just a few months hence) is the 4th strongest week of the year for Sales $ for Watches and Jewellery.
Every other category in the Kepler Retail Index was not able to positively influence their sales in the key week leading into Valentine’s Day.
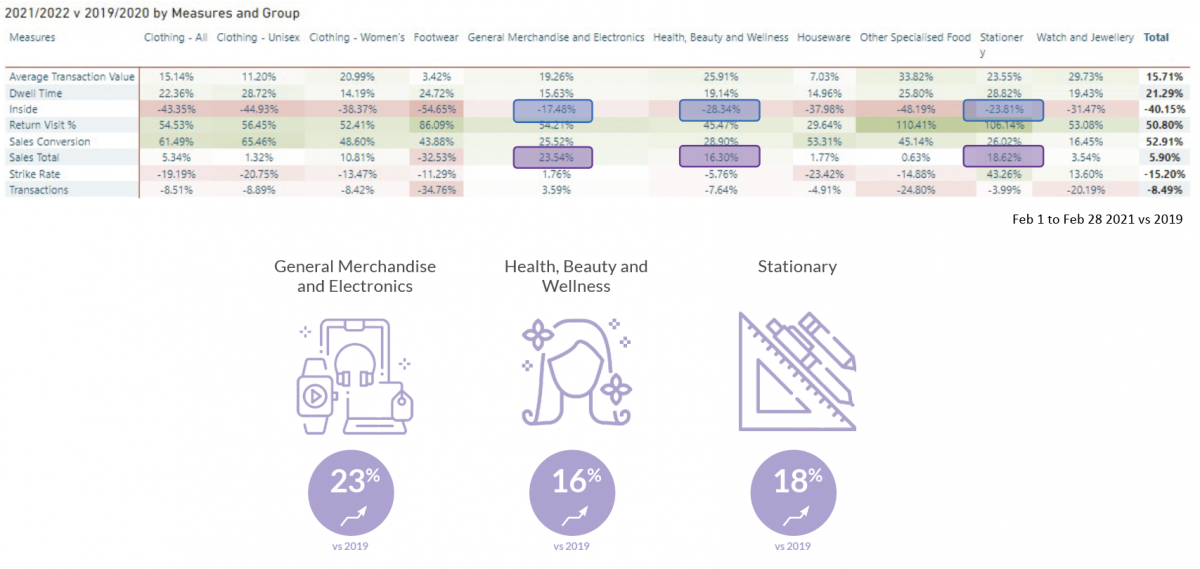
2021 is compared to 2019 (pre COVID-19).
In 2021 vs 2019, three categories had strong sales growth (see purple highlights below).
Key drivers of this Sales $ growth were Sales Conversion Rate and ATV $, with traffic substantially down. (Lockdown exceptions had an impact).
The increase in customers returning to stores mitigated lower traffic in:
Valentine’s Day is a key event in the retail calendar
The profile of trade for February has been extremely stable for 3 years.
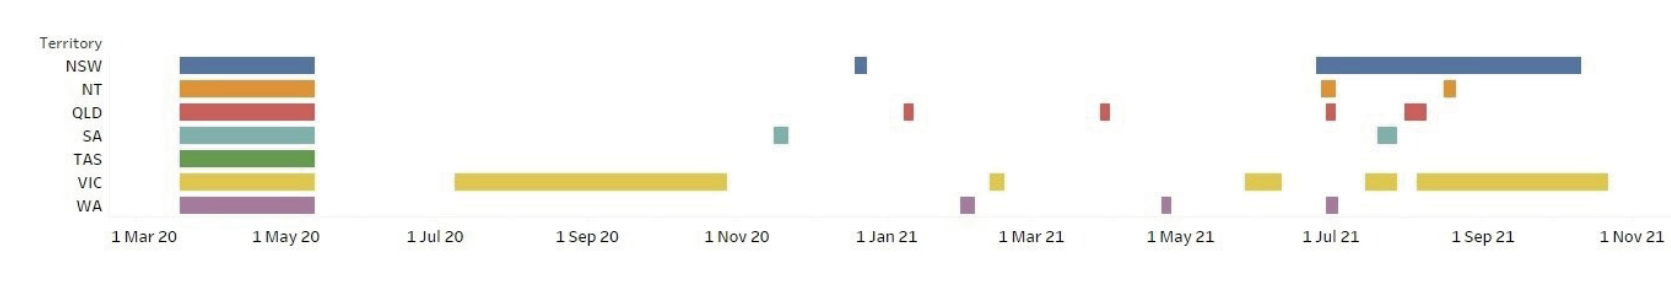
The opportunities for retailers are to ensure that offers, stores and executions drive Inside Traffic. Inside Traffic has been under significant pressure as COVID-19 cases increased.
Customer loyalty and inspiring Return Visits into stores is central to efforts to maintaining Inside Traffic levels.
There is a suggestion in the data that February is attracting higher Sales $ in the year (Kepler will monitor trend to validate) which may affect:
| Cookie | Duration | Description |
|---|---|---|
| cookielawinfo-checkbox-analytics | 11 months | This cookie is set by GDPR Cookie Consent plugin. The cookie is used to store the user consent for the cookies in the category "Analytics". |
| cookielawinfo-checkbox-functional | 11 months | The cookie is set by GDPR cookie consent to record the user consent for the cookies in the category "Functional". |
| cookielawinfo-checkbox-necessary | 11 months | This cookie is set by GDPR Cookie Consent plugin. The cookies is used to store the user consent for the cookies in the category "Necessary". |
| cookielawinfo-checkbox-others | 11 months | This cookie is set by GDPR Cookie Consent plugin. The cookie is used to store the user consent for the cookies in the category "Other. |
| cookielawinfo-checkbox-performance | 11 months | This cookie is set by GDPR Cookie Consent plugin. The cookie is used to store the user consent for the cookies in the category "Performance". |
| viewed_cookie_policy | 11 months | The cookie is set by the GDPR Cookie Consent plugin and is used to store whether or not user has consented to the use of cookies. It does not store any personal data. |
Simply fill in your details below and we will be in touch to arrange your free custom assessment and comprehensive demo.
Simply fill in your details below and we will be in touch to arrange your free custom assessment and comprehensive demo…