Click on the image to enlarge
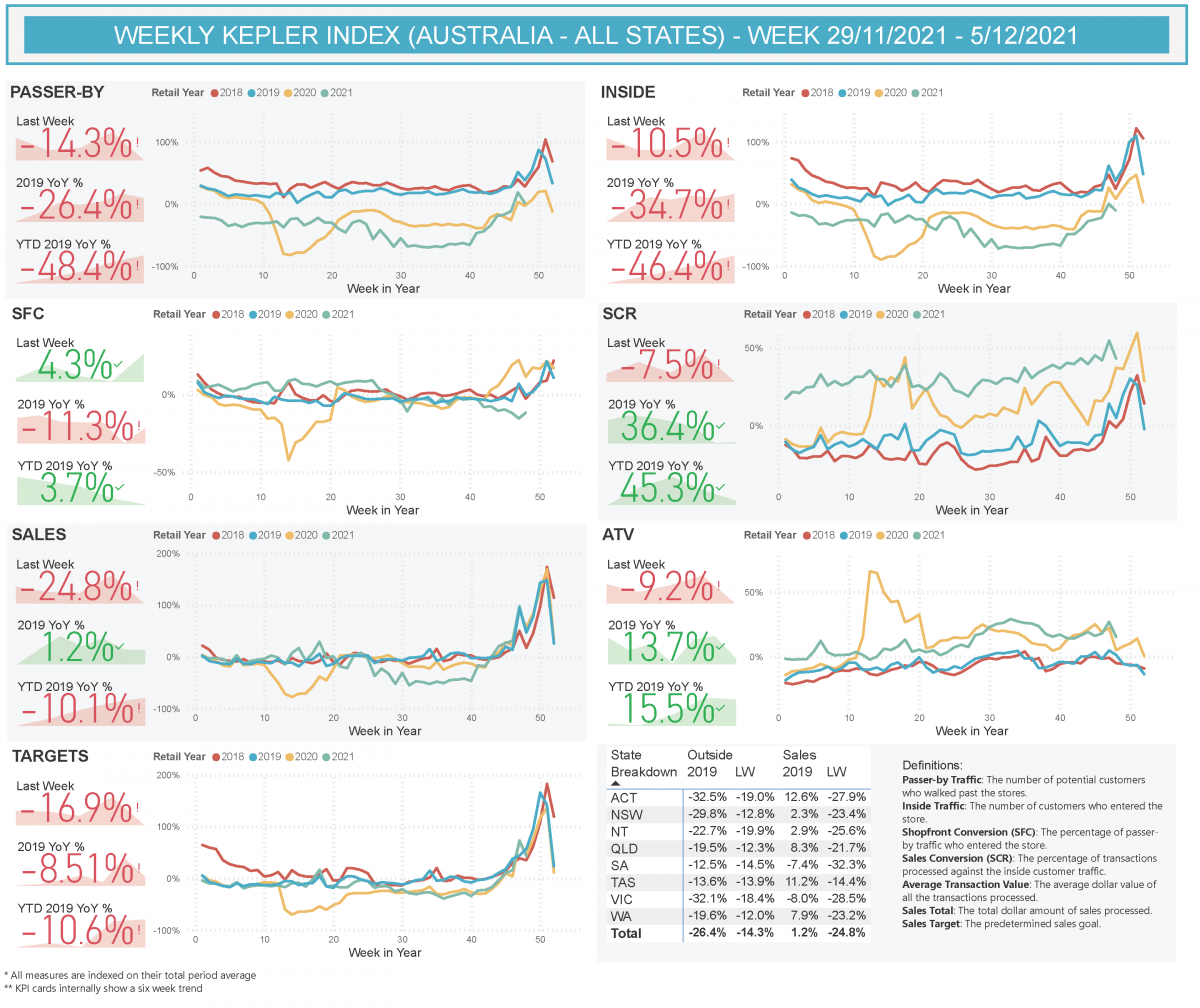
All States
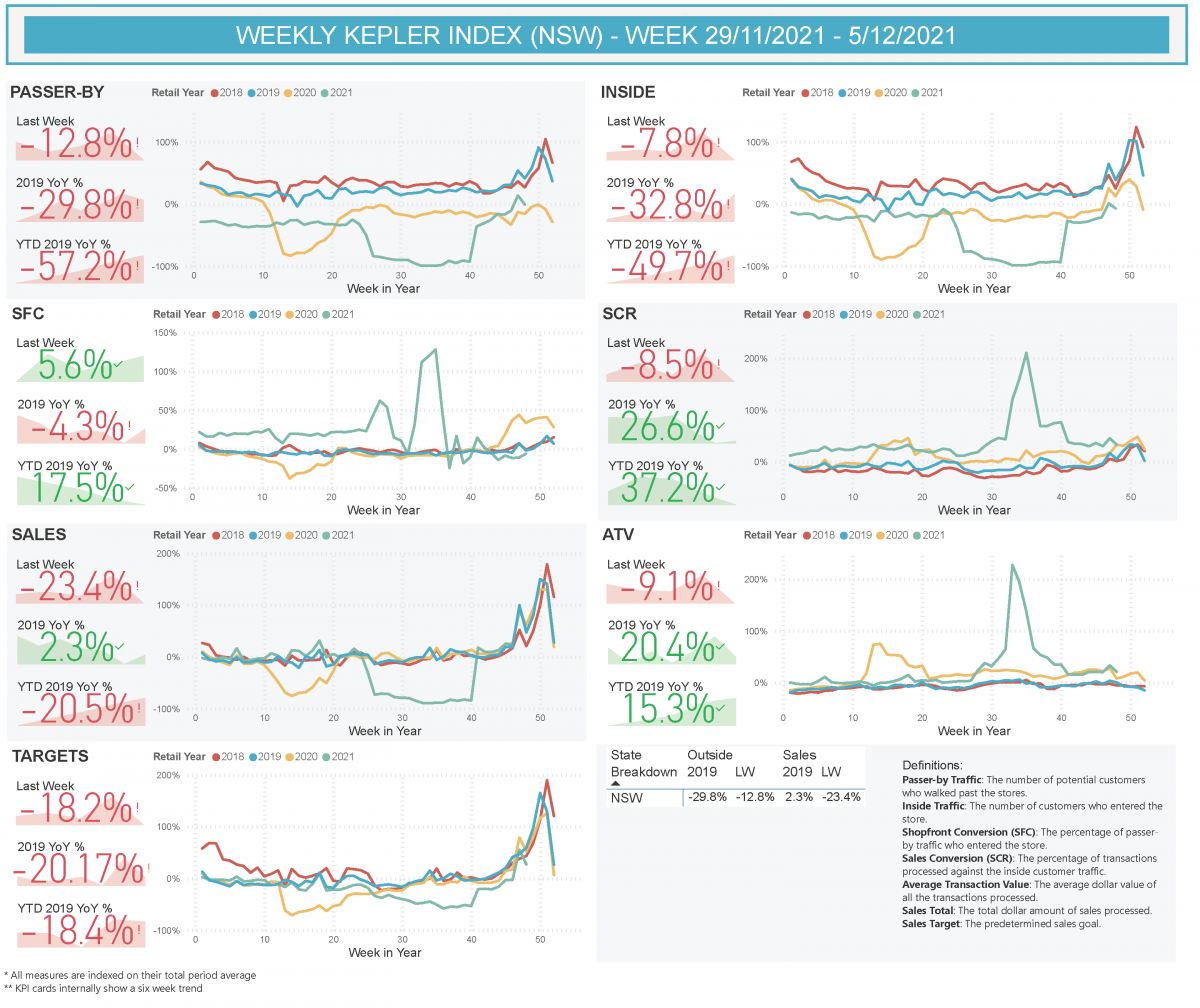
NSW
VIC
QLD
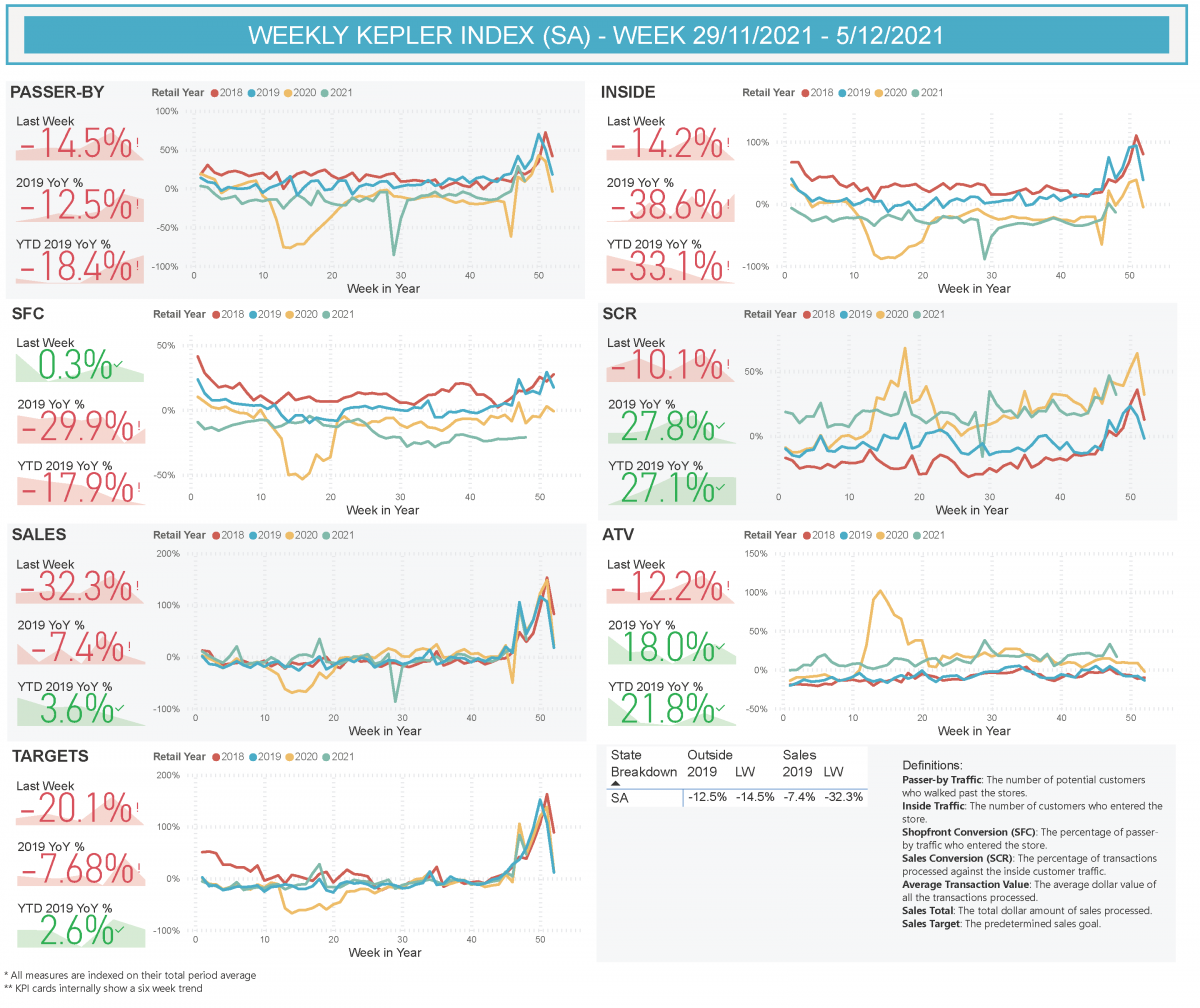
SA
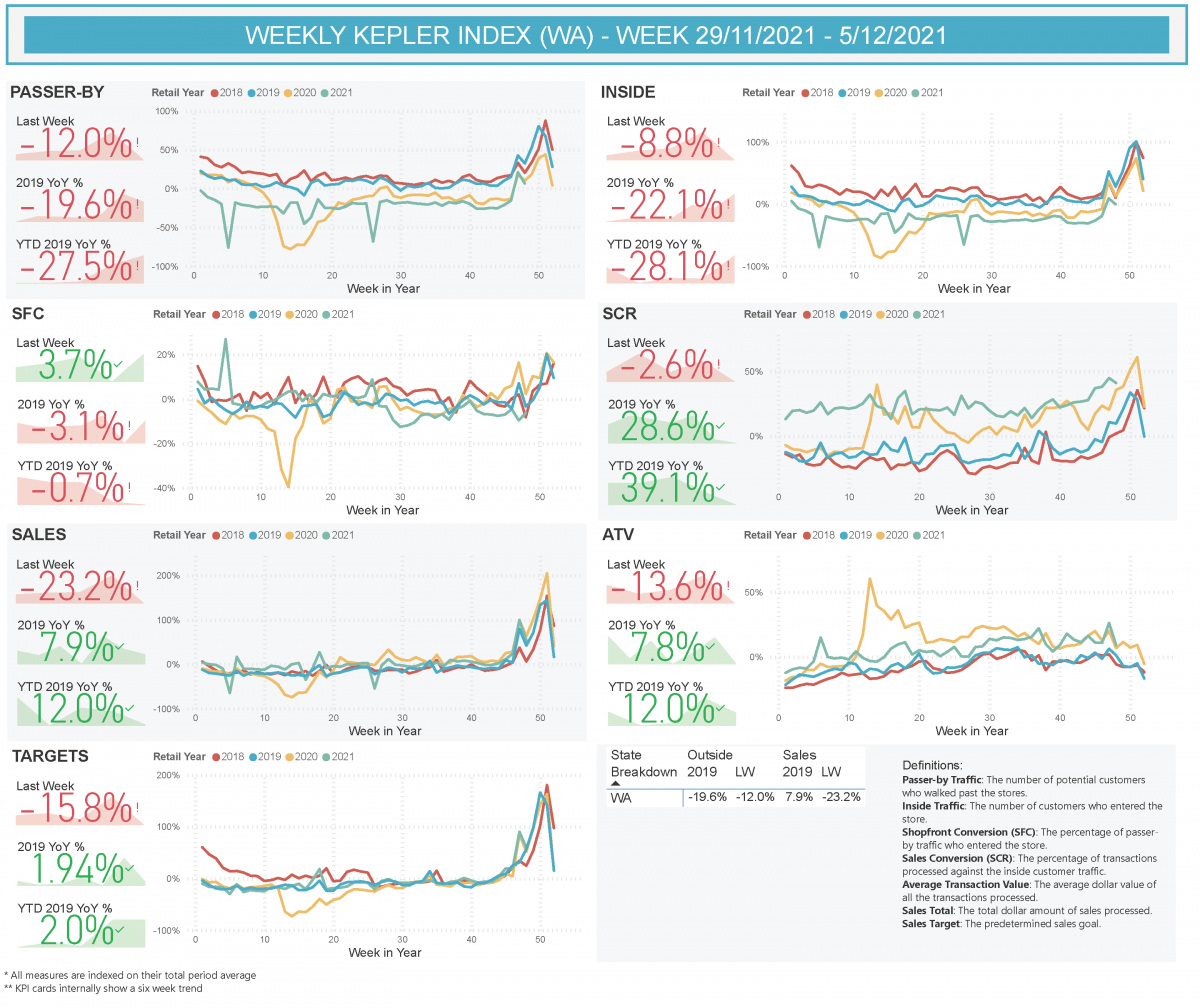
WA
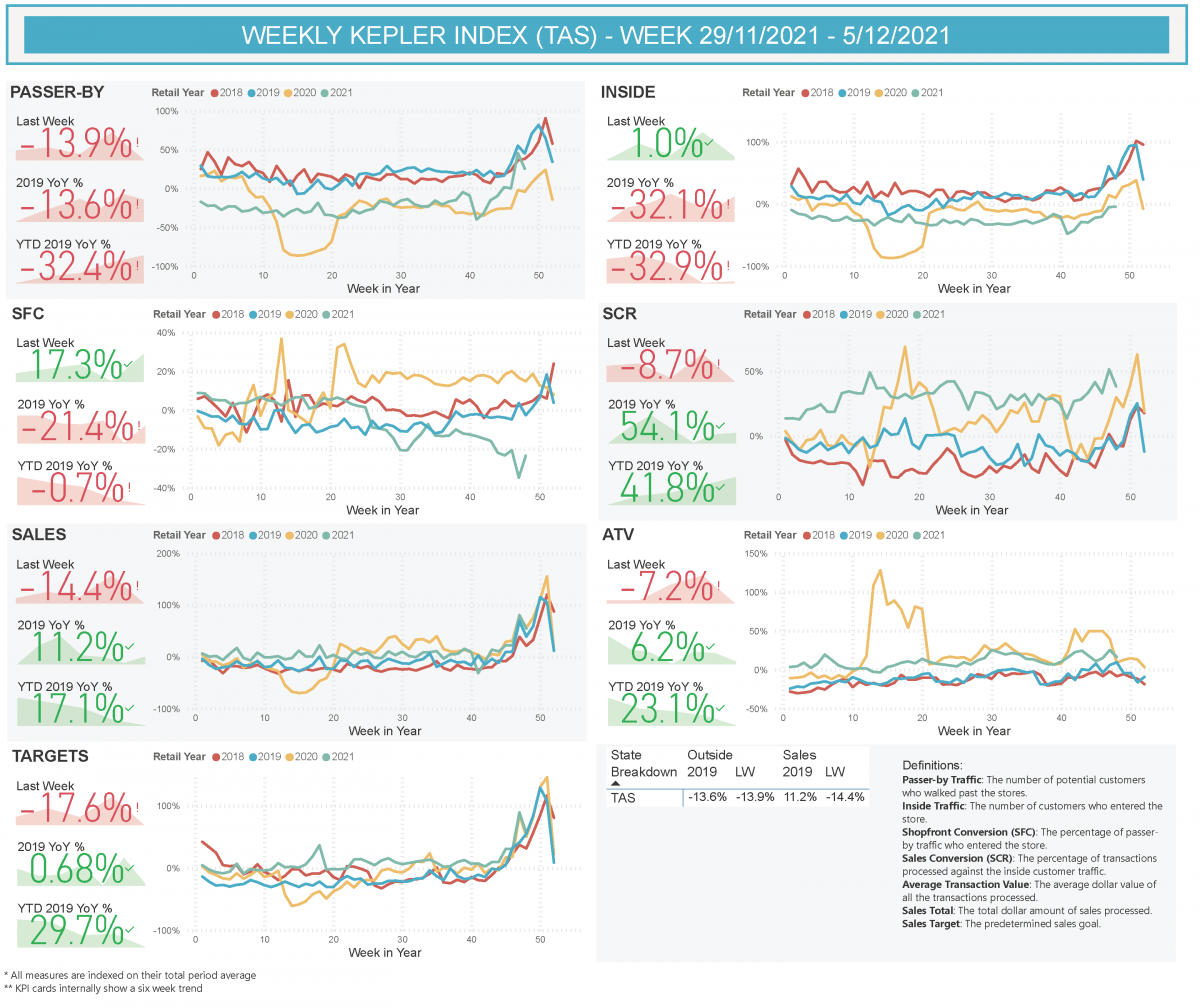
TAS
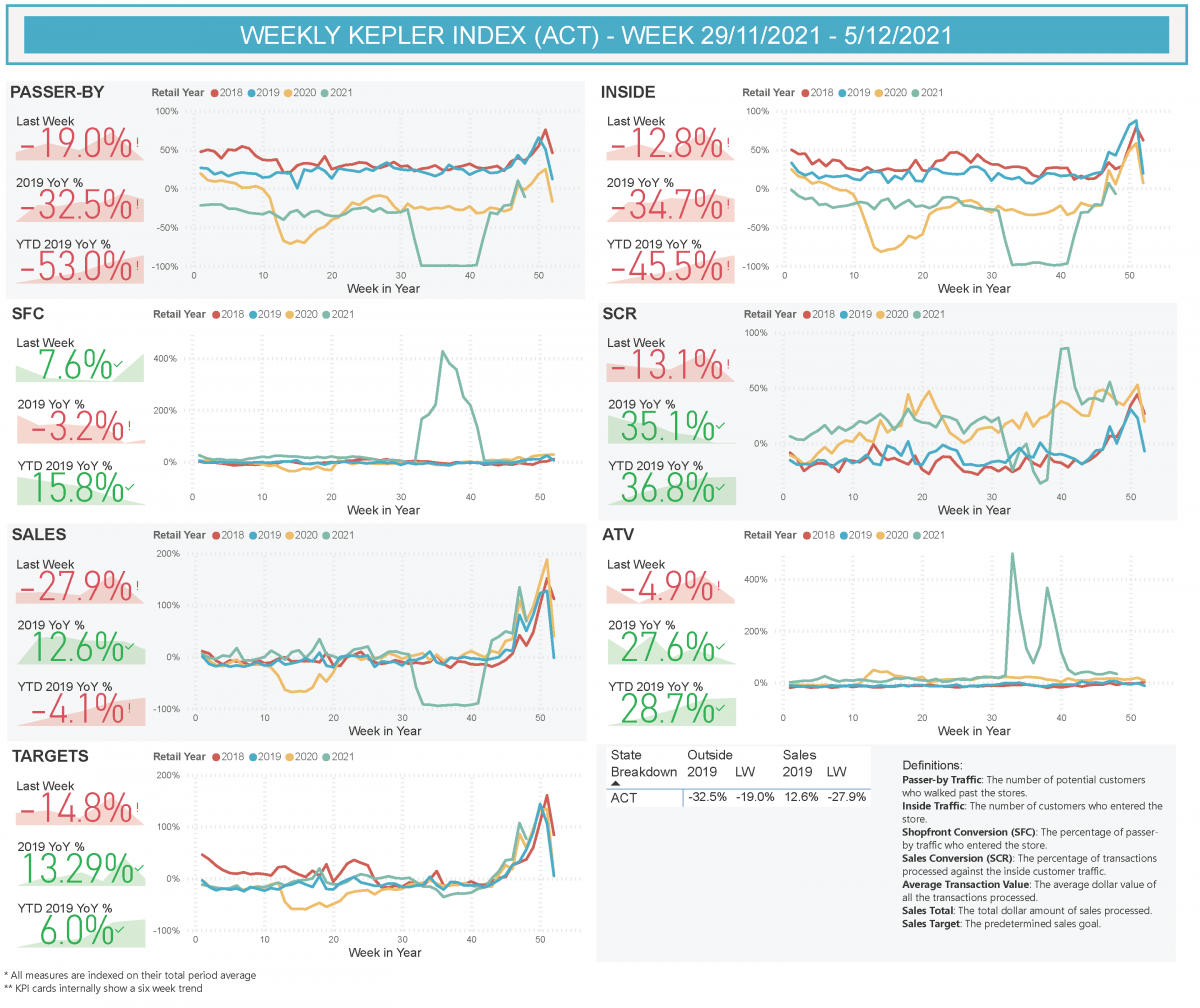
ACT
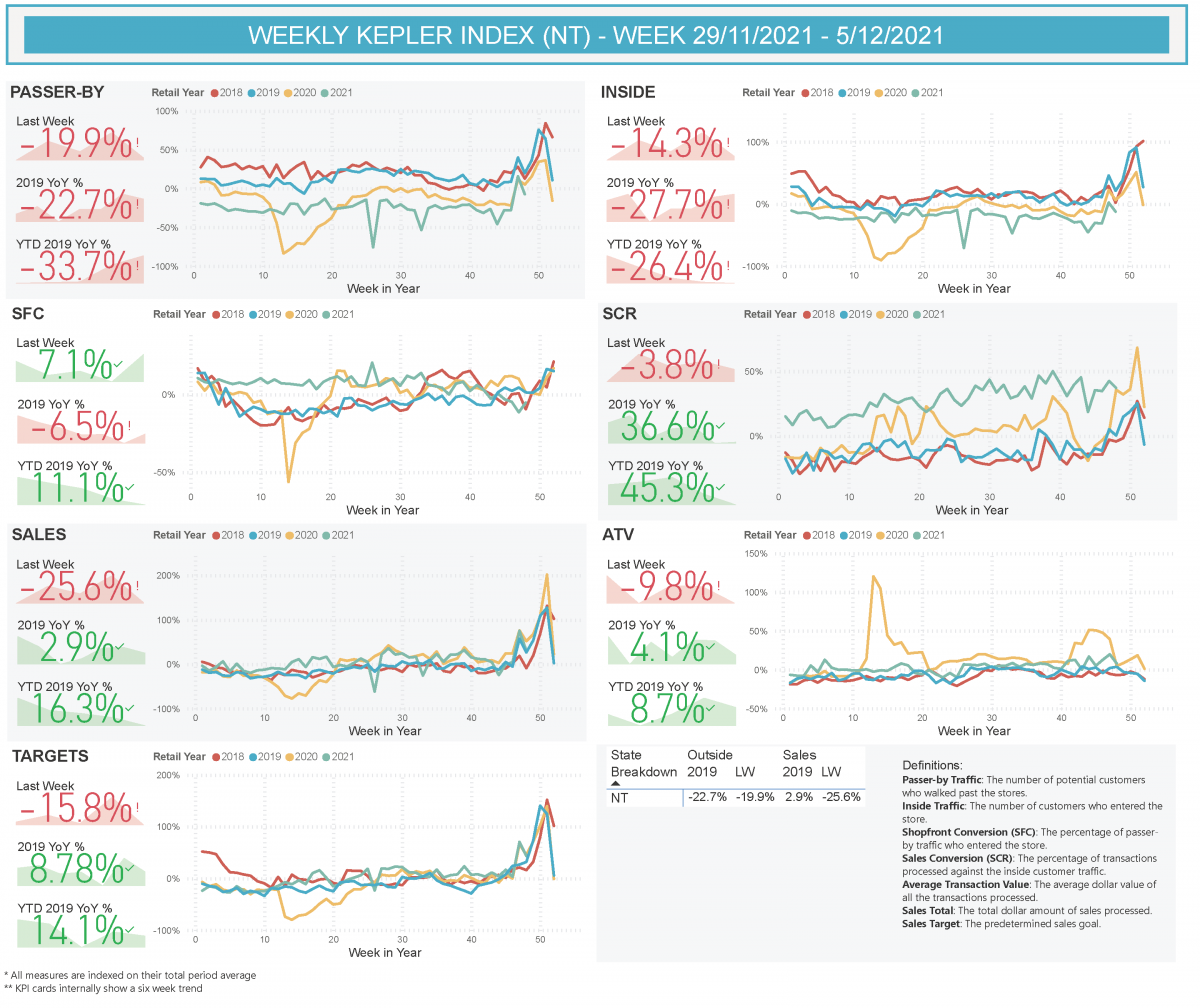
NT
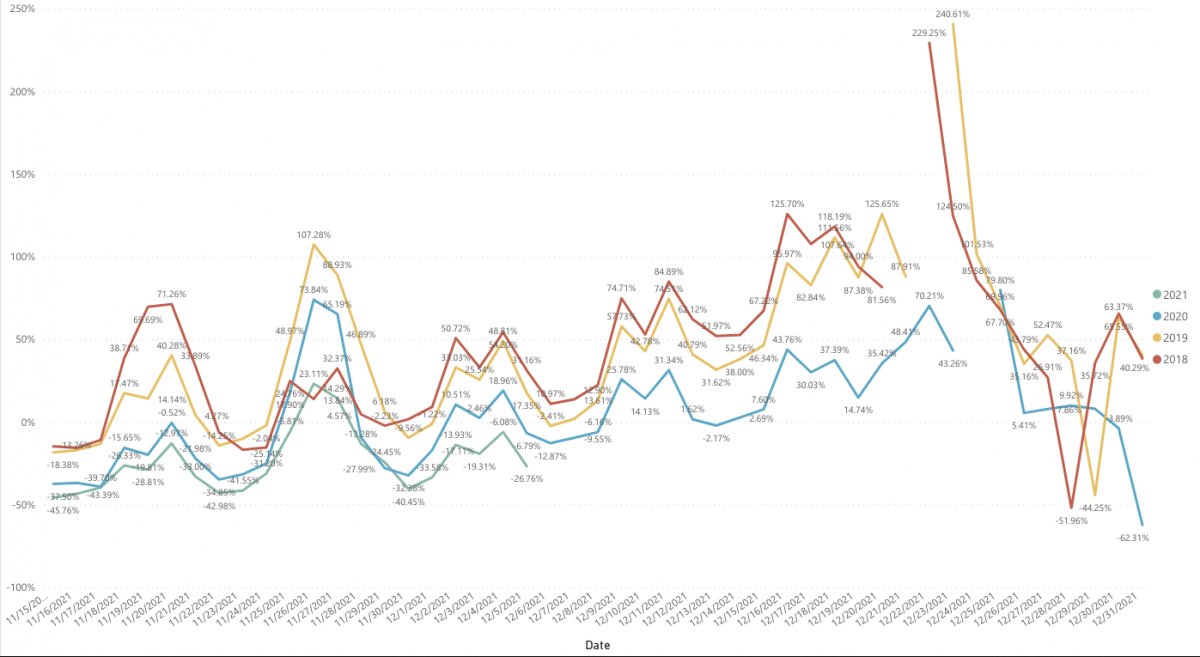
Weekly Worm
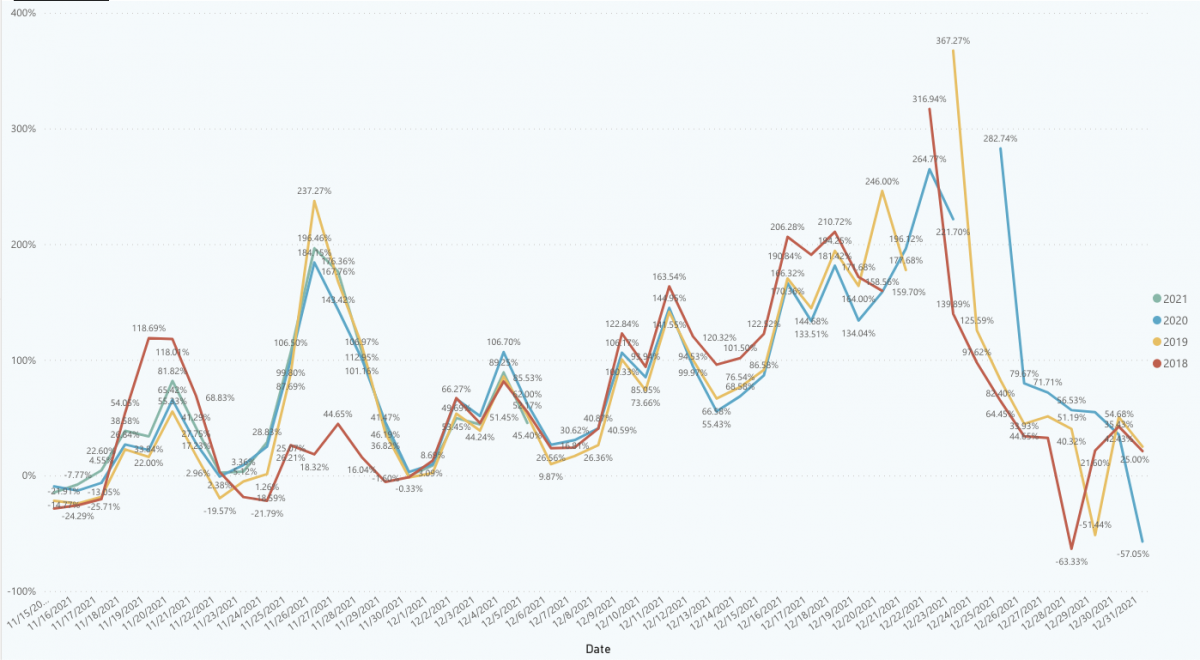
The following graphs will show the percentage (%) change vs baseline date of 1st November (2019) for each measure.
To allow for data matching and alignment to the correct day of the week, some data during Christmas has been excluded.
Inside Traffic
($) Sales


